- Presidents and the U.S. Economy: An Econometric Exploration (2015), by Princeton University economists Alan S. Blinder and Mark W. Watson
- Between 1947-2013 real GDP grew at an annualized rate of 3.33% Under Democratic presidents the growth was 4.33% versus 2.54% under Republican presidents.
- princeton.edu/~mwatson/papers/DemRep_BlinderWatson_July2015.pdf
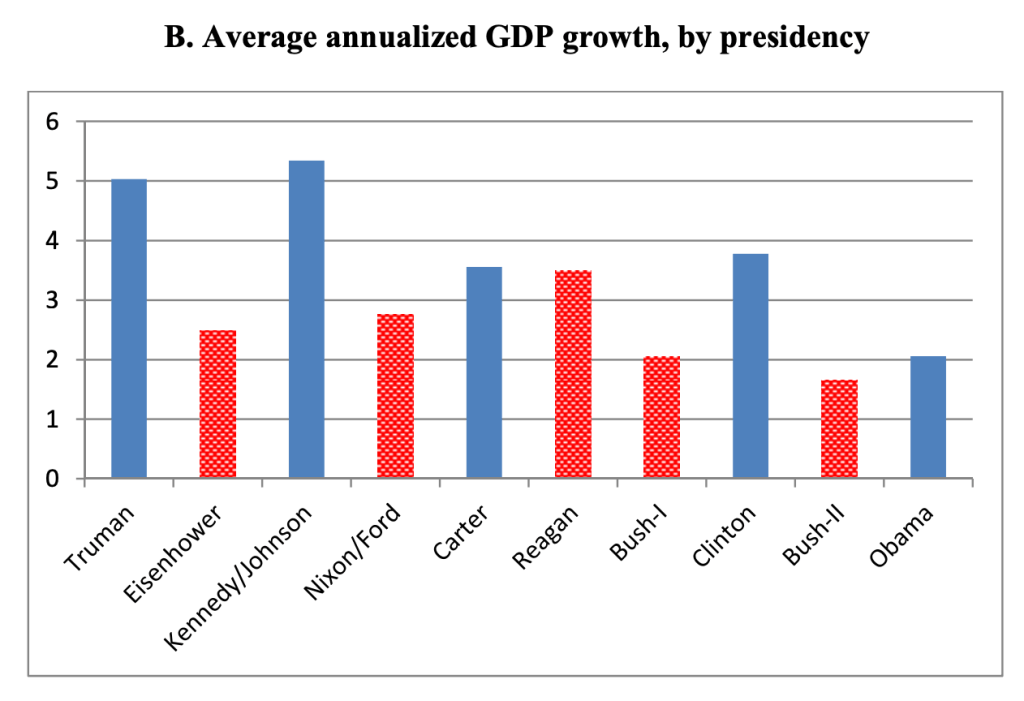
Image Credit: princeton.edu/~mwatson/papers/DemRep_BlinderWatson_July2015.pdf
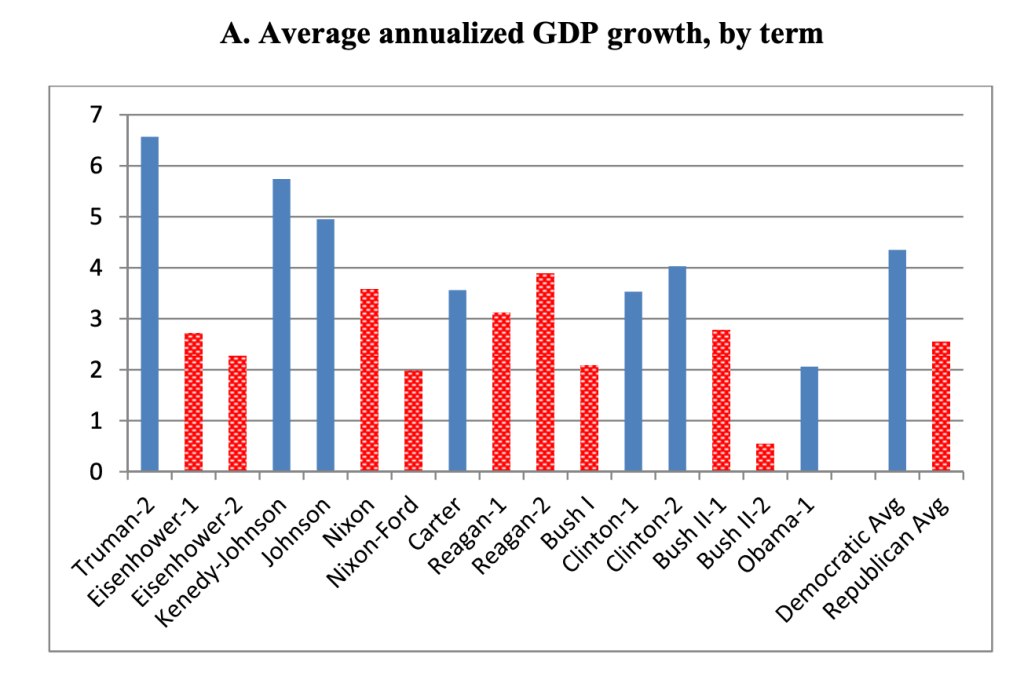
Image Credit: princeton.edu/~mwatson/papers/DemRep_BlinderWatson_July2015.pdf
- Why Are Republican Presidents So Bad for the Economy (2021), David Leonhardt, Graphics by Yaryna Serkez
- Since 1933, the economy has grown at an annual average rate of 4.6 percent under Democratic presidents and 2.4 percent under Republicans, according to a Times analysis.
- nytimes.com/2021/02/02/opinion/sunday/democrats-economy.html
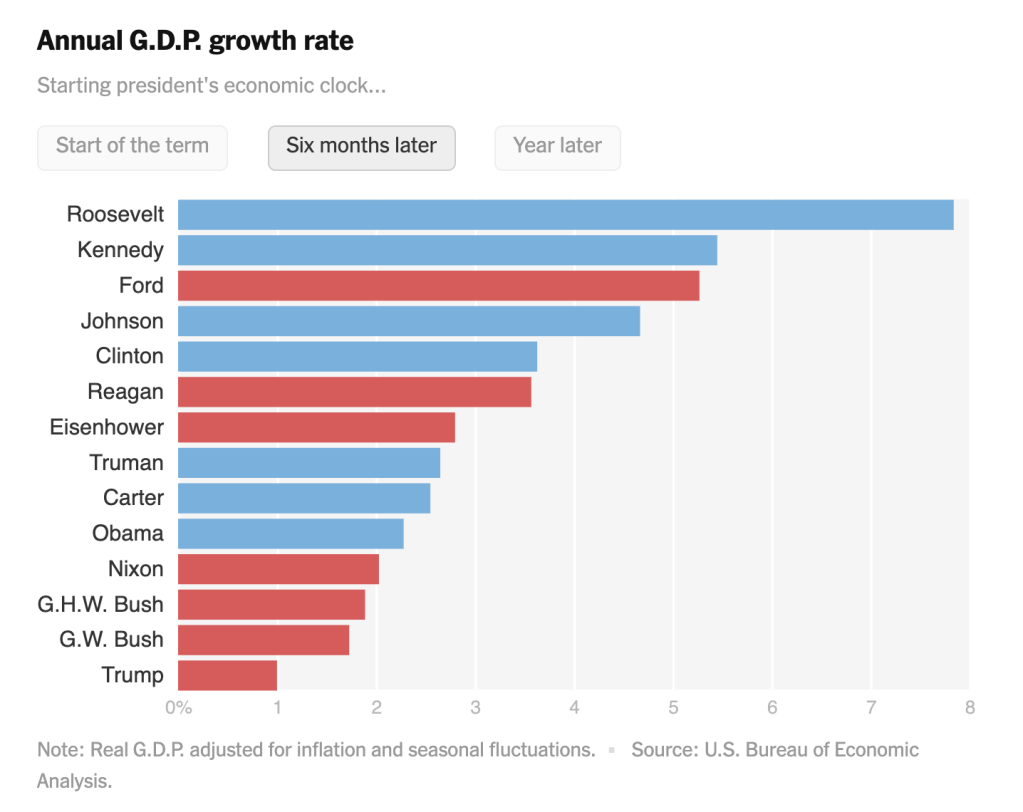
Image Credit nytimes.com/2021/02/02/opinion/sunday/democrats-economy.html
- U.S. economic performance under Democratic and Republican presidents, Wikipedia
- Historically, the United States economy has performed better on average under the administration of Democratic presidents than Republican presidents since World War II. The reasons for this are debated, and the observation applies to economic variables including job creation, GDP growth, and stock market returns. The unemployment rate has fallen on average under Democratic presidents, while it has risen on average under Republican presidents. Budget deficits relative to the size of the economy were lower on average for Democratic presidents. Ten of the 11 U.S. recessions between 1953 and 2020 began under Republican presidents.
- wikipedia.org/wiki/U.S._economic_performance_under_Democratic_and_Republican_presidents
