Back to Democracy
An electoral system is a set of protocols for designing ballots, casting votes, counting votes, determining winners, and recording results.
Outline
Election of a Single Officeholder
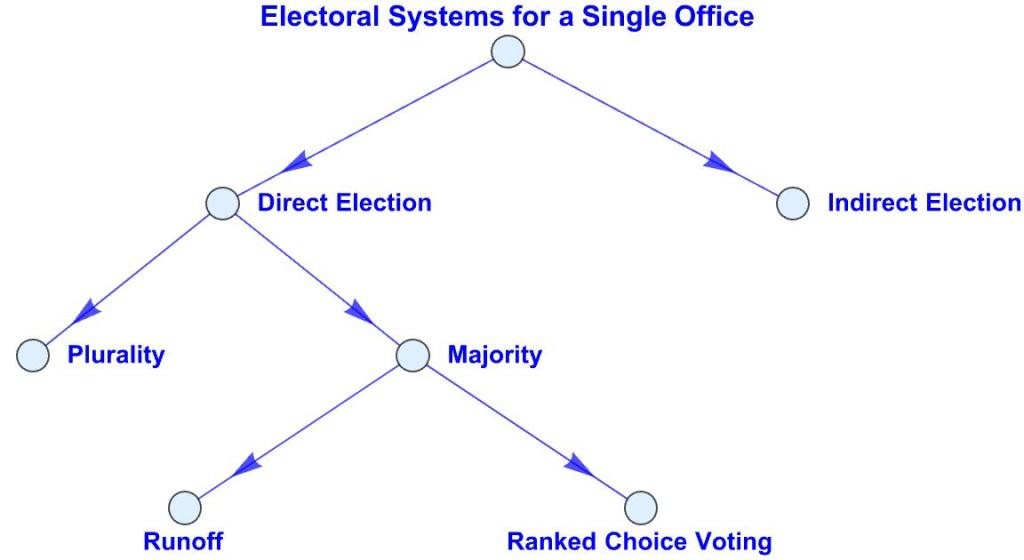
- Electing a mayor, governor, or president should be a no-brainer: people vote, the votes are counted, and the candidate with the most votes wins. If there are more than two candidates, there’s the question whether the winner should be required to receive a majority of the votes or a mere plurality. The latter is easy to implement. The former may require a runoff election or the use of ranked-choice voting.
- A candidate can also be elected indirectly, where people vote for proxies who directly elect the office-holder.
Direct Election
Plurality (First Past the Post)
- In plurality voting, the candidate with more votes than anyone else is elected.
- The system is straightforward, easily understood, and widely used.
- A downside is that, in a three-person race, two candidates of the same party may split the vote, enabling the opposition party to win with less than a majority. A Democratic candidate might win with 40 percent of the vote, for example, with two Republican candidates each getting 30 percent.
- US Senators and Representatives are elected by a plurality in 46 states.
- The other four states require a majority to win.
- Louisiana and Georgia hold runoff elections.
- Maine and Alaska use ranked-choice voting.
Majority
- In majority voting, a candidate must get more than 50 percent of the total number of votes to win.
Possible Runoff (Two-Round System)
- If there are more than two candidates and no one wins a majority, a runoff election is held to decide the winner.
- In a two-candidate runoff only the top two vote-getters compete. The runoff election must be won by majority.
- In a multi-candidate runoff, more than two candidates are on the ballot. The runoff election is won by plurality.
Ranked Choice Voting (Instant Runoff, Alternative Vote)
- The idea of Ranked Choice Voting (Instant Runoff, Alternative Vote) is that, instead of holding a runoff election, voters specify their backup choices when they vote.
- So on their ballots voters rank candidates in the order they want them to win.
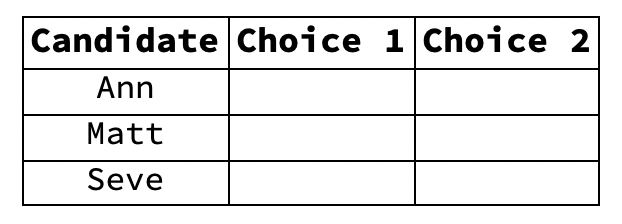
- Suppose three candidates run for mayor: Ann, Matt, and Steve
- A blank ballot looks like this:
- Voters mark their first and second choices, for example:
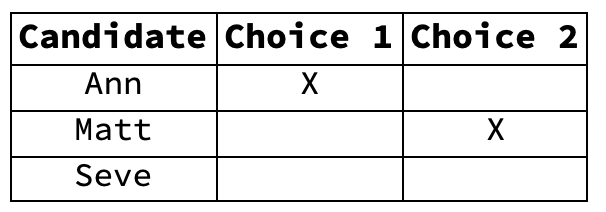 and
and 
- The two ballots are votes Ann, but with different backup choices.
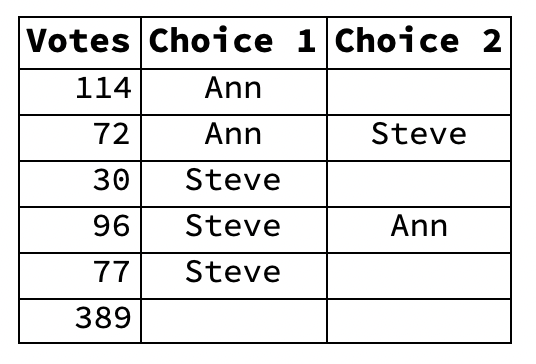
- Let’s assume a spreadsheet of the final tally of ballots looks like this:
- Ballot Spreadsheet #1
- Ballot Spreadsheet #1
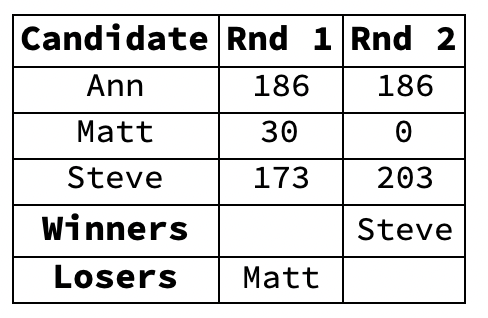
- The first-choice totals are thus:
- Ann 186
- Matt 30
- Steve 173
- No candidate has a majority (195) of the 389 votes. When this happens, the RCV protocol calls for the candidate with the least number of votes to be eliminated and their votes transferred to their second choices. With the least number of votes, Matt is erased from the spreadsheet and his 30 votes become Steve’s.
- The ballot spreadsheet now looks like this:
- Ballot Spreadsheet #2
- Ballot Spreadsheet #2
- Steve’s first-choice votes now total 203, giving him a majority of the vote. Steve therefore wins the election.

- Here’s the RCV procedure expressed as a flowchart:

- Per the Start Rounded-Rectangle at the top of the flowchart we make a spreadsheet tallying the ballots. That’s Ballot Spreadsheet #1 above.
- Per the Decision Diamond we ask whether any candidate has a majority. Adding up the total votes for each candidate on Ballot Spreadsheet #1 we find the answer is No.
- So we follow the No Arrow to the Process Rectangle, which tells us to eliminate the candidate with the fewest votes. That’s Matt with 30 votes. Matt is replaced by his second his choice, Steve. The result is Ballot Spreadsheet #2 above.
- We follow the Arrow back to the Decision Diamond, which asks, based on the updated spreadsheet, whether anyone has a majority. The answer this time is Yes: Steve with 203 votes.
- Following the Yes Arrow to the End Rounded-Rectangle, the process ends with Steve winning the election.
- The process can be summarized as a sequence of total votes by candidate per round.
- Where RCV is used:
- View Mathematica Program for Ranked Choice Voting and Single Transferable Vote
Indirect Election
- The most straightforward way of electing a president, governor, or mayor is by direct popular vote.
- Curiously, in a handful of countries, including the United States, the head of government is elected indirectly, by people voting for proxies who directly elect the head of government.
- Indirect election raises the question: what’s the justification for an electoral system that
- is more complicated than direct popular vote
- can result in the election of a candidate who fails to get the most votes?
- View Electoral College
- “Among democracies, the U.S. stands out in how it chooses its head of state“, 2016, Pew Research Center
- Besides the U.S, the only other democracies that indirectly elect a leader who combines the roles of head of state and head of government (as the U.S. president does) are
- Botswana
- Federated States of Micronesia
- Marshall Islands
- Nauru
- South Africa
- Suriname.
- Besides the U.S, the only other democracies that indirectly elect a leader who combines the roles of head of state and head of government (as the U.S. president does) are
Election of a Legislature
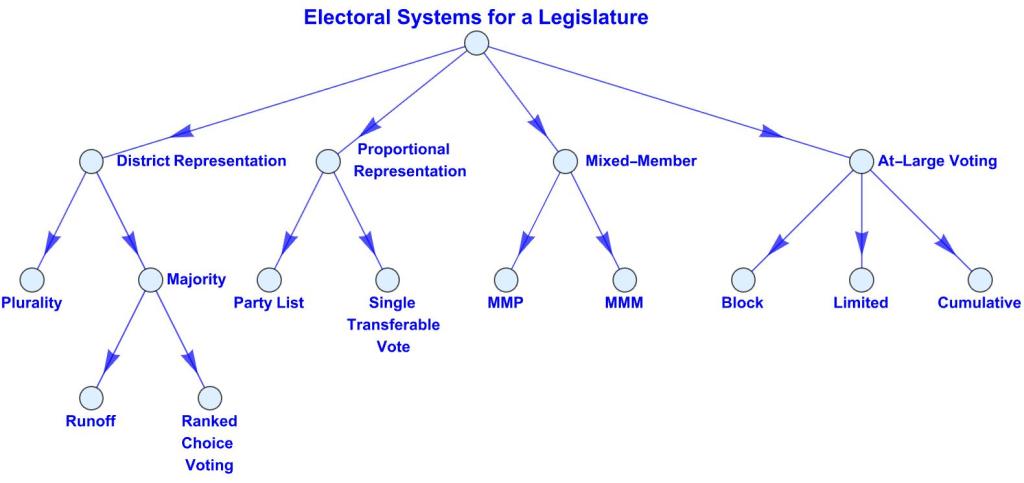
- The most widely used electoral systems for electing a legislature are District and Proportional Representation. Less used systems are At-Large Voting and Mixed-Member Systems.
- In District Representation, legislators are elected by the members of the districts they represent. The proportion of seats a party wins thus equals the proportion of district elections its candidates win.
- In Proportional Representation, the proportion of seats a party wins more or less equals the proportion of votes it receives, depending on the algorithm.
- In At-Large Voting, citizens vote for their choice of candidates to fill all seats in the legislature. The top vote-getters win seats.
- In Mixed-Member systems, citizens vote for both for a candidate to represent their districts and a party that wins seats proportional in number to the votes it receives.
- The best way to understand these systems is to see how they operate in the same, simple scenario:
- A small country of 500 citizens has a legislature of five seats and two political parties: Orange and Green. Five Orange candidates (O1, O2, O3, O4, and O5) and five Green candidates (G1, G2, G3, G4, and G5) compete in an election to fill all five seats. In the election 265 citizens nationwide vote for the Orange Party or its candidates. 235 citizens nationwide for the Green Party or its candidates.
Proportional Representation
- In Proportional Representation, the proportion of seats a party wins more or less equals the proportion of votes it receives, depending on the algorithm.
- Proportional systems are of two basic kinds: the straightforward Party List System and the ingenious Single Transferable Voting system.
- In the Party List system, citizens vote for parties rather than individual candidates. Parties win seats in proportion to the number of votes they receive. Variants of the system, of which there are many, are used in:
- Argentina, Austria, Belgium, Brazil, Bulgaria, Colombia, Costa Rica, Cyprus, Czech Republic, Denmark, Finland, Greece, Iceland, Israel, Luxembourg, Mozambique, Netherlands, Norway, Portugal, Slovakia, South Africa, Spain, Sweden, Switzerland, Turkey, Uruguay
- View Party List Systems in More Detail
- In the Single Transferable Vote system voters rank candidates in the order they want them to win. Voters’ preferences are translated into seats by an algorithm consisting of a series of rounds in which, one by one, candidates are either eliminated or win a seat based on the preferences.
- Though preferences are for individual candidates, voters effectively vote for a party if their preferences are for candidates of the same party .
- STV is used in Australia, Ireland, and Malta.
- View Single Transferable Vote in More Detail
- To see how proportional representation works in our scenario, we’ll use a simple Party List system in which the proportion of seats a party wins is simply set equal to the proportion of votes it receives.
- The 500 citizens of our hypothetical country vote by filling out the same, simple ballot:
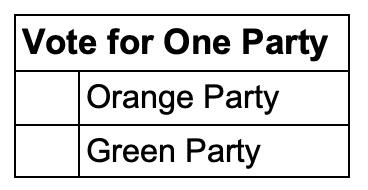
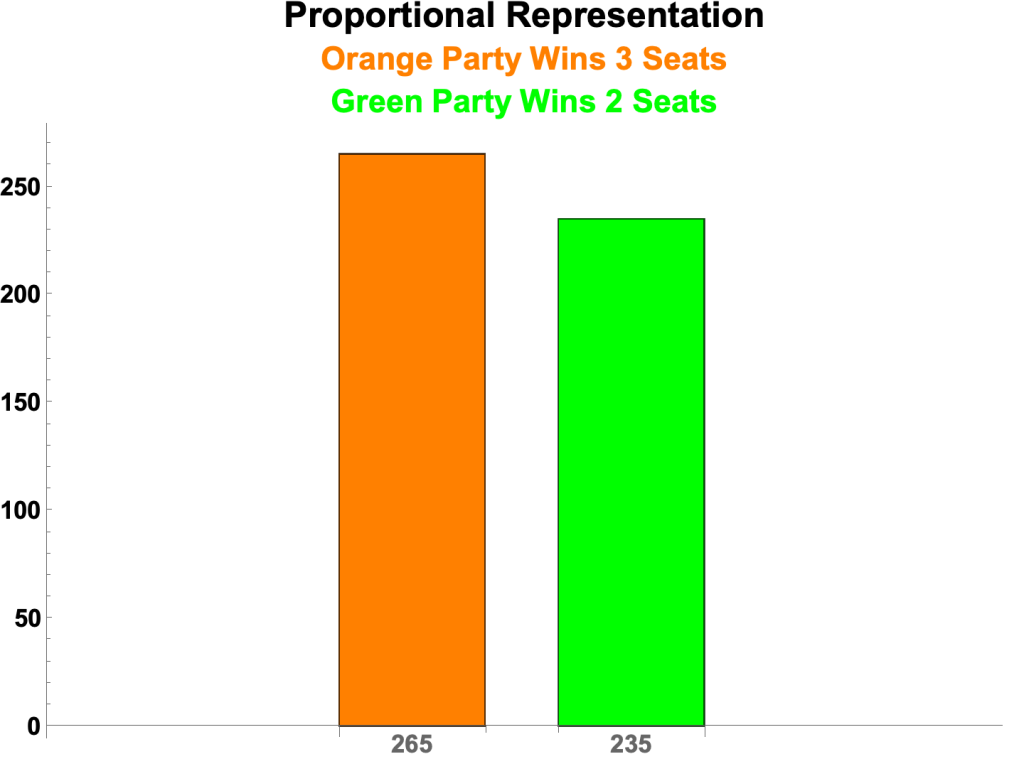
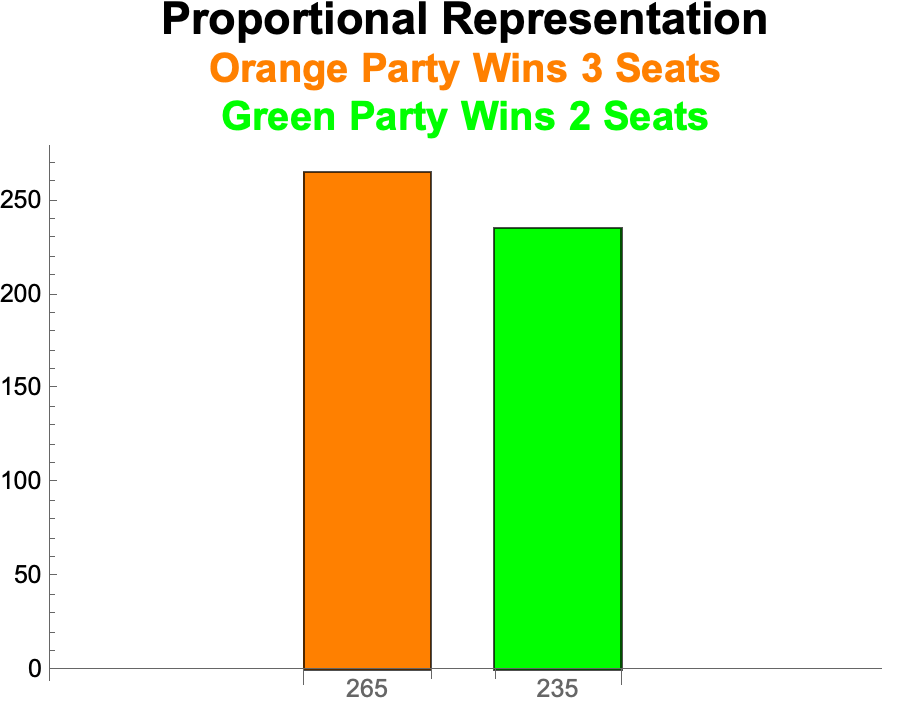
- The Results
- There are 265 votes for the Orange Party and 235 votes for the Green Party.
- We set the proportion of seats each party wins equal to the proportion of votes it received.
- So Orange wins 3 seats
- Round[(265 / 500) x 5] = 3
- And Green wins 2 seats.
- Round[(235 / 500) x 5] = 2
District Representation
- In District Representation, legislators are elected by the members of the districts they represent.
- Let’s divide our hypothetical country into five electoral districts of 100 members each.
- Each district conducts its own election between an Orange candidate and a Green candidate.
- So the ballots look like this:
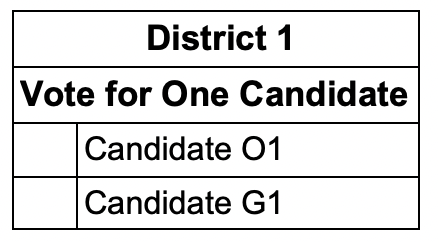 ,
, 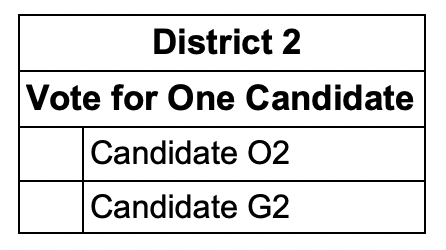 , and so on.
- Results
- The number of seats a party wins equals the number of districts its candidates win.
- In our scenario, we’ve assumed that nationwide 265 citizens vote for Orange candidates and 235 citizens for Green candidates. That rules out Green wining all five seats.
- That’s because to win a district Green would need 51 votes. Hence to win all five districts Green would need 51 x 5 = 255 votes, more than Green has.
- But all other outcomes are possible:
- Two examples:
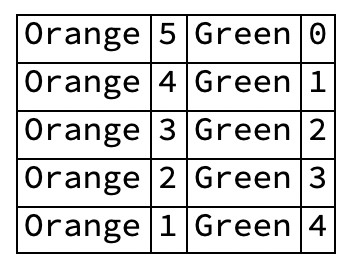
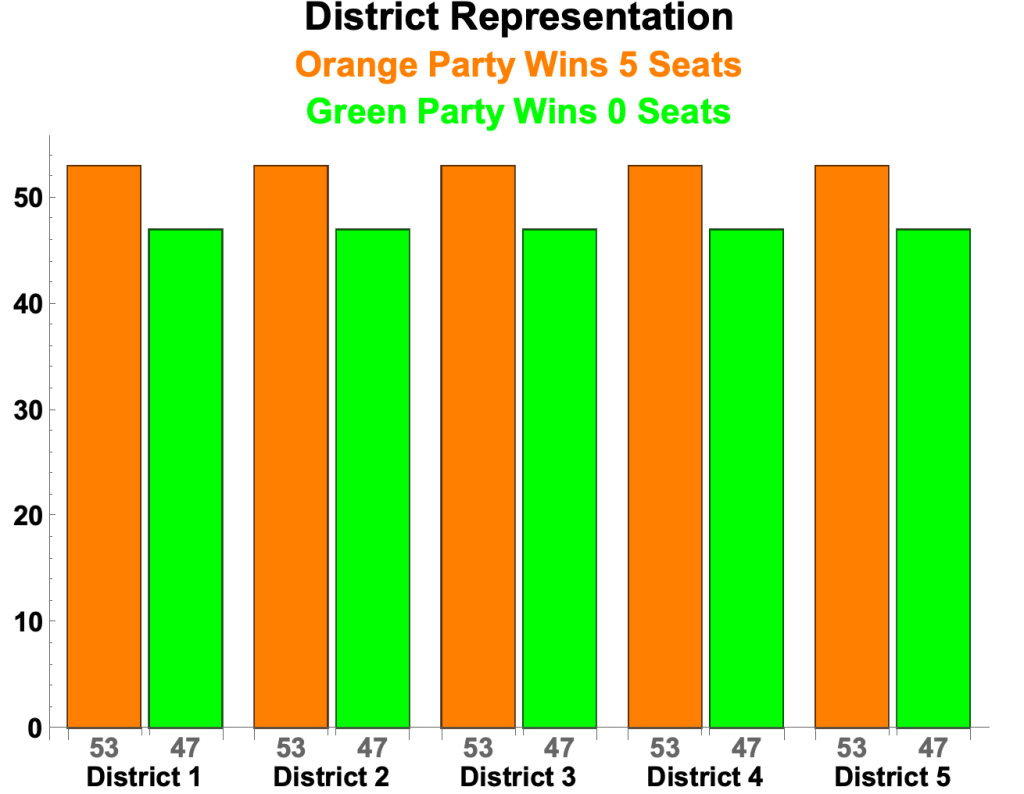
Orange Wins all 5 Seats
- Orange wins each district 53 to 47
- The nationwide vote totals are thus:
- Orange: 53 x 5 = 265
- Green: 47 x 5 = 235
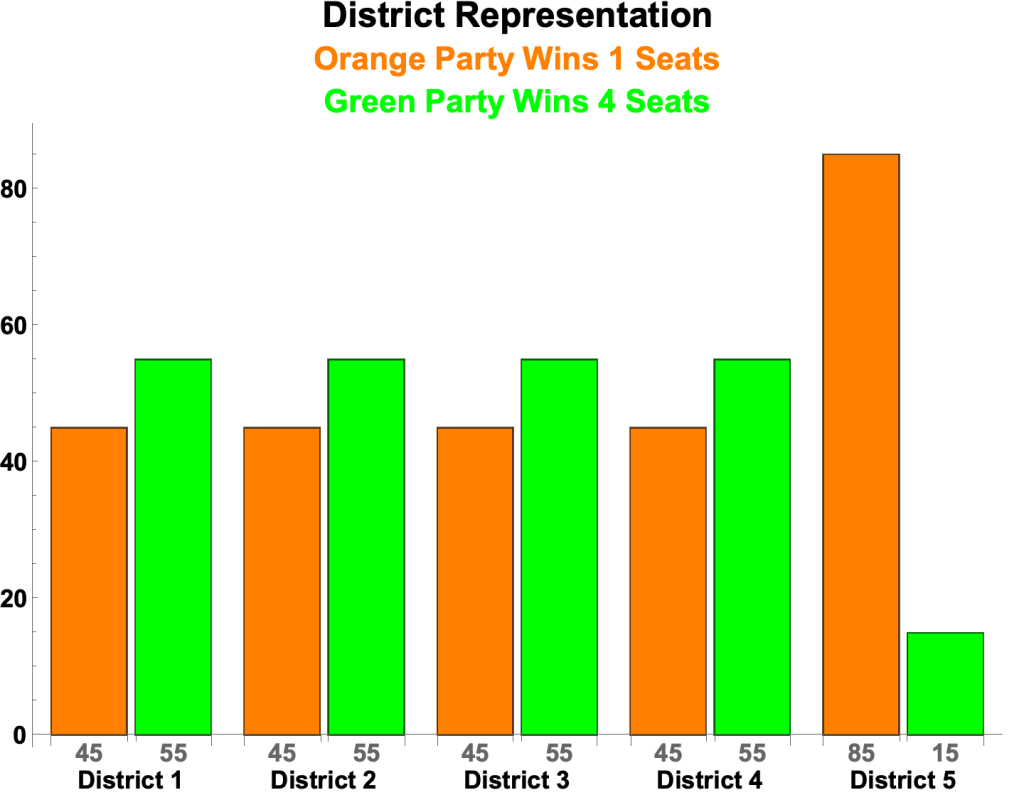
Green wins 4 seats and Orange 1
- Green wins four districts 55 to 45 and Orange wins the fifth 85 to 15.
- The nationwide vote totals are thus:
- Green 55 x 4 + 15 = 235
- Orange 45 x 4 + 85 = 265
View Bar Charts for All Possible Outcomes
- In District Representation the proportion of seats a party wins depends in part on the overall proportion of votes it gets but also in part on how votes are distributed across electoral districts. Thus:
- The proportion of seats parties win can vary from the proportion of votes they get. In the extreme, a party can win a majority of seats without winning a majority of votes.
- Anything that affects the distribution of votes can affect the proportion of seats, such as gerrymandering.
At-Large Voting
- In At-Large Voting, citizens vote for their choice of candidates to fill all seats in the legislature. The top vote-getters win seats.
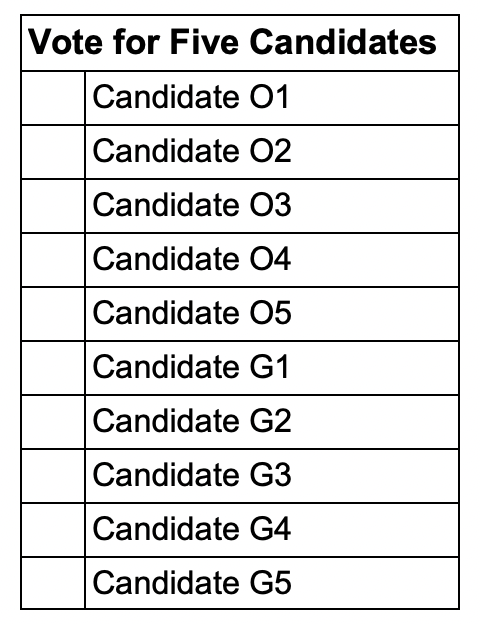
- Using Block Voting, the most commonly used form of At-Large Voting, all 500 citizens of our hypothetical country vote for (up to) five of the ten candidates to fill the five seats. The top five vote-getters win seats.
- Everyone fills out the same ballot:
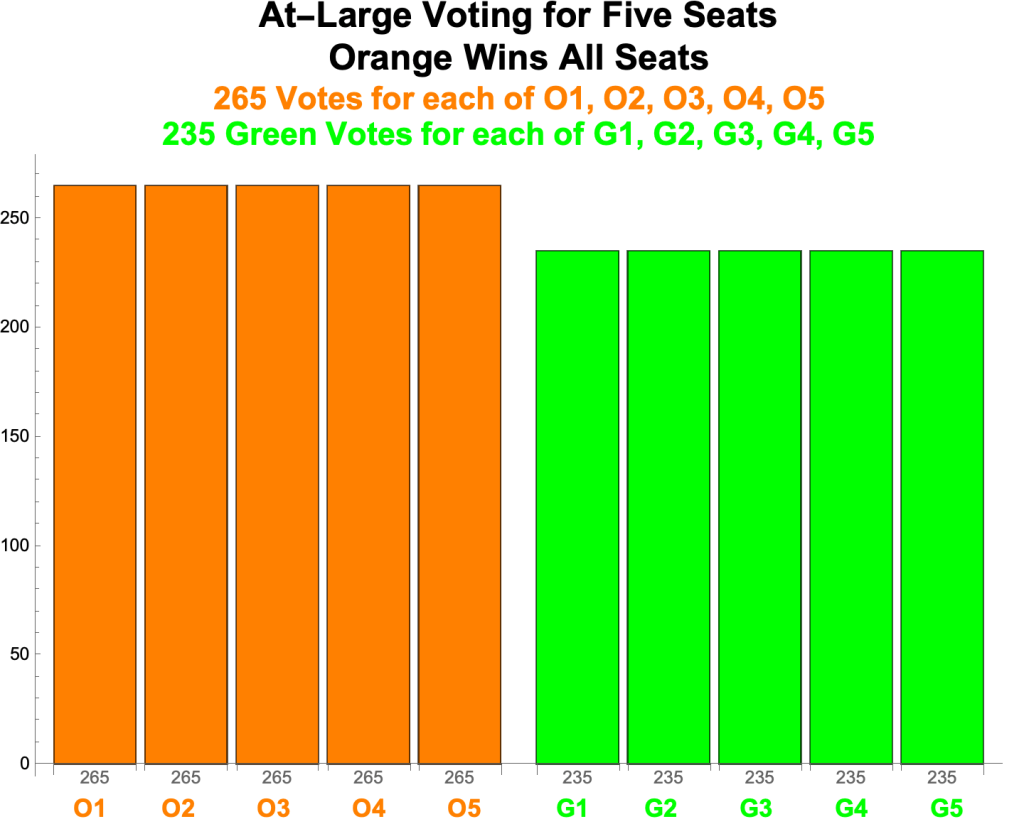
- Results
- There are 265 votes for each of O1, O2, O3, O4, and O5. And 235 votes for each of G1, G2, G3, G4, and G5.
- The top five vote-getters are O1, O2, O3, O4, and O5. So the Orange Party wins all five seats.
- At-Large Voting Variants
- In Block Voting, voters vote for n candidates
- where n is the number of seats to be filled
- In Limited Voting voters vote for k candidates
- where k is less than the number of seats
- In Single Non-Transferable Voting (SNTV), voters vote for only one candidate
- In Cumulative Voting voters can vote for the same candidate more than once.
- For example, casting 3 votes for O1 and 2 for O2
- In Block Voting, voters vote for n candidates
Mixed-Member Systems
- Mixed-Member systems combine district and proportional representation.
- There are two basic ways of combining such systems.
- In Mixed-Member Majoritarian (MMM) systems half the seats are filled by district representation and half by proportional representation.
- In Mixed-Member Proportional (MMP) systems district representation is constrained by proportional representation
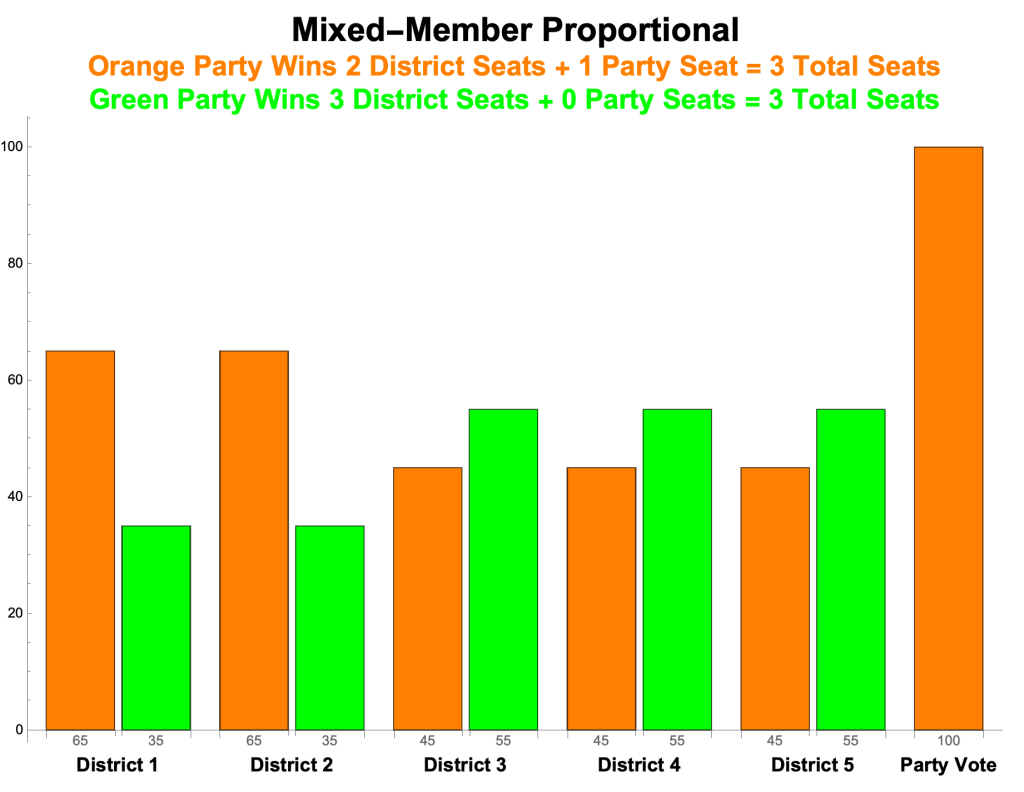
Mixed-Member Proportional Systems
- An MMP system is basically election by district constrained so that it yields proportional results.
- MMP is used by Bolivia, Germany, and New Zealand.
- Let’s assume, as we did earlier in discussing District Representation, that there are five electoral districts of 100 members each.
- Each district conducts its own election between (1) an Orange candidate and a Green candidate and (2) the Orange Party and the Green Party.
- Ballots look like this:
 and
and 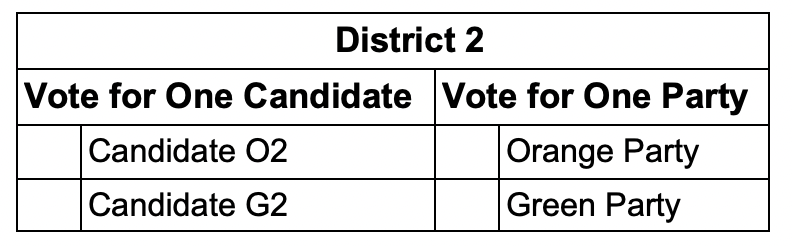
- In the election 265 citizens nationwide vote for the Orange Party and its five district candidates. 235 citizens nationwide vote for the Green Party and its five district candidates.
- We’ll assume that Orange candidates win Districts 1 and 2 and Green candidates win Districts 3, 4, and 5.
- Here’s how the number of seats a party wins is calculated.
- Calculation for Orange’s seats:
- Let d be the number of districts the party wins. For Orange, d = 2.
- Let p be the number of seats proportional to the party’s share of total party votes. For Orange p = 3, as we saw earlier in discussing proportional representation.
- Round[(265/500) 5] = 3
- The number of seats the party wins is the larger of d and p. For Orange, that’s 3 seats, occupied by the winners of Districts 1 and 2 along with a third official chosen by the party.
- Calculation for Green’s seats:
- Green candidates won Districts 3, 4, and 5. So d = 3.
- Green wins 2 seats based on the proportion of its share of the total party vote. So for Green p = 2
- Thus Green wins 3 seats, occupied by its district winners.
- But the legislature has a total of 5 seats and Orange has 3 of them. Green has what’s called an Overhang of 1 vote. Overhangs are accommodated by temporarily increasing the number of seats in the legislature, until the next election.
- The results of the election, then, are:
- Orange: 3 seats
- Green: 3 seats
Mixed-Member Majoritarian Systems
- In an MMM system half the seats are filled by district elections and half by proportional party vote.
- Let’s replace the five 100-member districts with two districts of 250 citizens each. Two of the legislature’s five representatives, representing the districts, are elected by district representation. The other three are elected by proportional representation.
- Like MMP, every citizen votes for both a candidate and a party. The ballots are the same:
- and
- Results
- There are 265 votes for the Orange Party and 235 for the Green Party.
- Thus Orange wins 2 of the 3 proportional seats
- Round[(265 / 500) 3] = 2
- And Green wins 1.
- Round[(235 / 500) 3] = 1
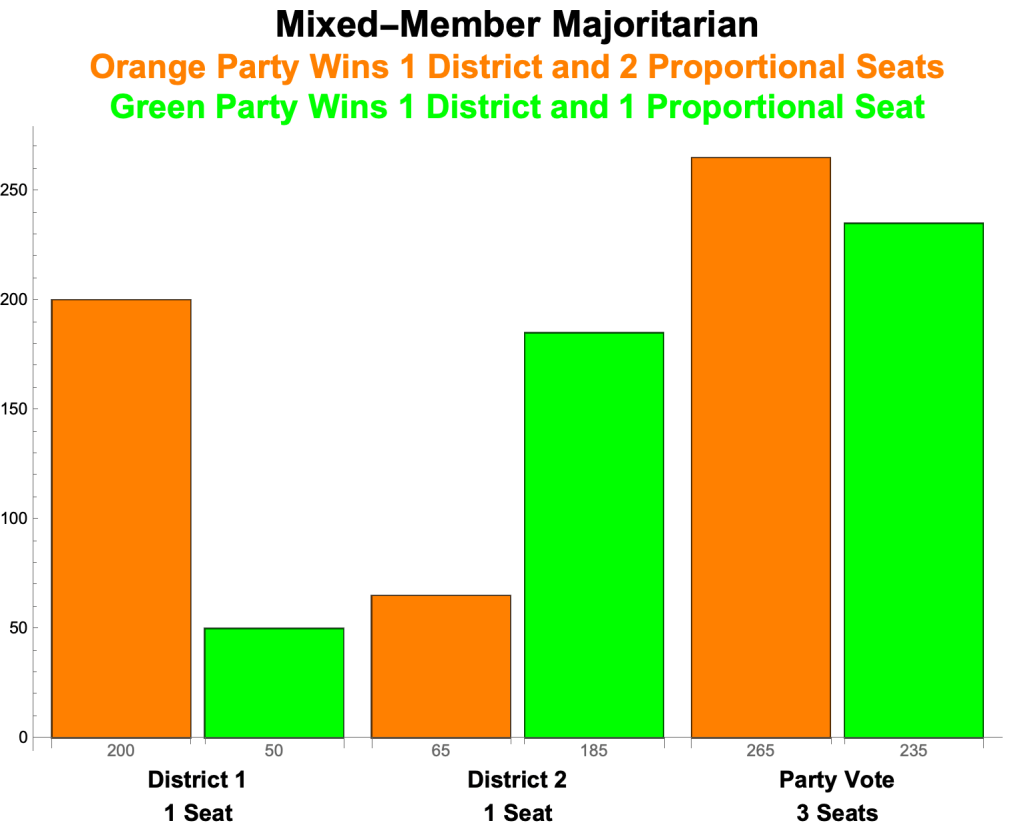
- For the two district seats, there are two possibilities:
- Orange wins both districts, thus winning a total of four seats.
- Orange and Green each win 1 district and therefore Orange wins a total of 3 seats and Green 2.
Final Result #1: Orange wins 4 seats, Green 1
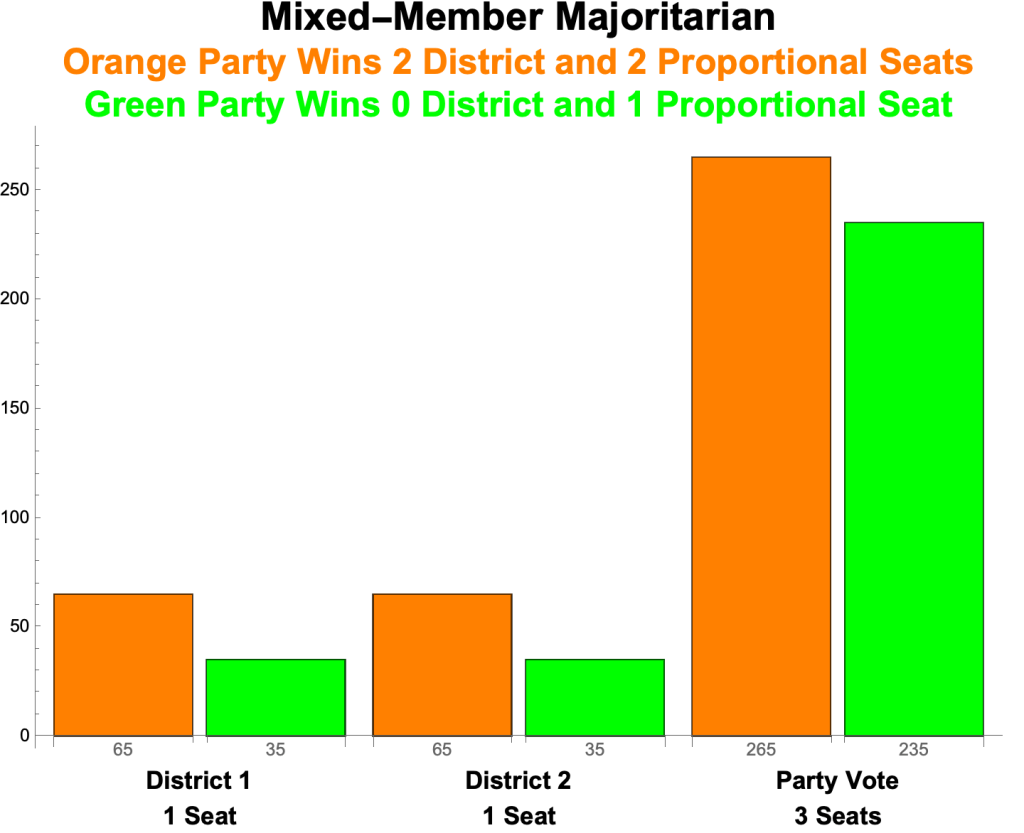
Final Result #2: Orange wins 3 seats, Green 2
Topics
- Two Concepts of Representation
- Party List Systems in More Detail
- Single Transferable Vote in More Detail
- The Fundamental Problem with District Representation
- Links to Sites on Electoral Systems
- Orange and Green Parties: Same Vote Totals, Five Different Outcomes
- Wasted Votes and the Efficiency Gap
- One Person, One Vote
Two Concepts of Representation
- Agent-Principal Representation
- In District Representation, individual legislators represent the interests of their districts, like an agent representing a principal or a lawyer representing a client.
- Model-Reality Representation
- In Proportional Representation, the legislature collectively represents the interests of the electorate through the allocation of seats to each political party in proportion to the number of votes it received. The legislature represents the electorate like a stick-and-ball model represents a molecule or an economic model represents the economy.
Party List Systems in More Detail
- The basic idea of the Party List System is that
- people vote for parties
- the proportion of seats a party wins is based on the proportion of votes it received.
- There are two kinds of algorithms for translating votes into seats
Largest Remainder
- The simplest, most proportional of the Party List Systems is the Largest Remainder System with what’s called the Hare Quota. It amounts to this:
- Each party gets the number of seats per the formula:
- Number of seats = (votes received / total votes) x number of seats, with remainder R
- Remainders are used to fill unfilled seats.
- Each party gets the number of seats per the formula:
- For example, 1,000 citizens vote among 3 parties to fill 10 seats. The results:
- Party A: 463 votes / 1000 total votes x 10 seats = 4 seats with remainder 63
- Party B: 426 votes / 1000 total votes x 10 seats = 4 seats with remainder 26
- Party C: 111 votes / 1000 total votes x 10 seats = 1 seat with remainder 11
- The tenth seat goes to Party A since it has the largest remainder, 63.
- Final results:
- Party A: 5 seats
- Party B: 4 seats
- Party C: 1 seat
View Mathematica Program for Largest Remainder
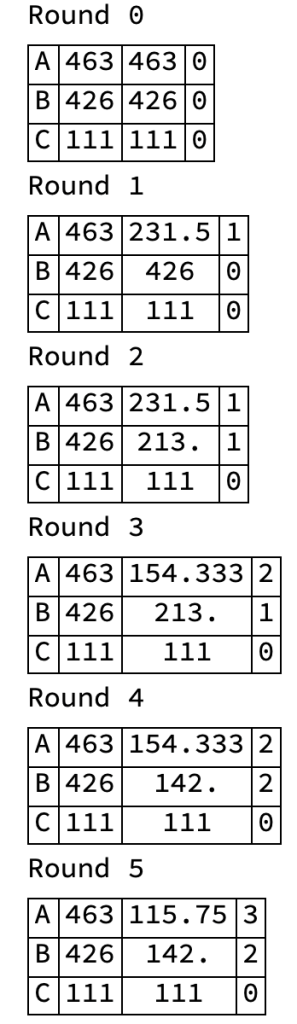
Highest Average
- The Highest Average System consists of a sequence of rounds, like a boxing match. The winner of a round gets a seat. So if there are 10 seats to be filled there are 10 rounds. Here’s the idea, using Parties A, B, and C
- Round 0: A’s original score = 463, B’s original score = 426, C’s original score = 111.
- A wins a seat with the high score, For next round A’s score is set equal to his number of votes, 463, divided by 2, which is 231.5
- Round 1: A’s score = 231.5, B’s score = 426, C’s score = 111.
- B wins a seat with the high score and his score for the next round is set equal to his number of votes, 426, divided by 2, which is 213.
- Round 2: A’s score = 231.5, B’s score = 213, C’s score = 111.
- A wins his second seat and his score for the next round is set equal to his number of votes, 463, divided by 3, which is 154.3
- Round 3: A’s score = 154.3, B’s score = 213, C’s score = 111.
- B wins his second seat and his score for the next round is set equal to his number of votes, 426, divided by 3, which is 142
- And so on for 10 rounds.
- A party’s divisor increases by 1 each time the party wins a seat.
- Round 0: A’s original score = 463, B’s original score = 426, C’s original score = 111.
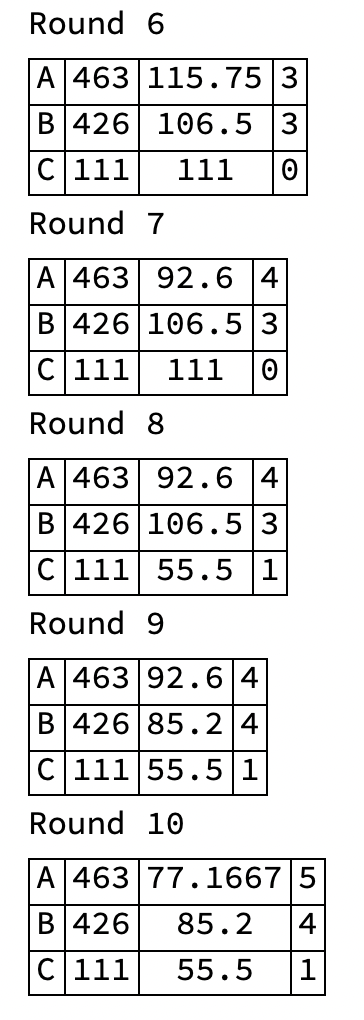
- The rounds are summarized below, where each row consists of:
- party Identifier, number of votes received, running score, total number of seats won
- The final result, from Round 10:
- Party A: 5 seats
- Party B: 4 seats
- Party C: 1 seat
View Mathematica Program for Highest Average
Single Transferable Vote in More Detail
- The Party-List System is a straightforward way of achieving proportional representation: the electorate votes directly for groups of voters. Single Transferrable Voting, developed independently be Thomas Hare and Carl Andræ in the mid 19th century, is an ingenious way of achieving proportional representation without predefining political parties.
- STV can be summarized as follows:
- Voters rank candidates in the order they want them to win.
- The STV algorithm consists of a series of rounds in which, one by one, candidates are either eliminated or win a seat — until all seats are filled.
- As the rounds proceed, “unproductive” votes are transferred from winning and eliminated candidates to voters’ next-ranked candidates.
- Unproductive votes are either
- votes for an eliminated candidate
- “surplus” votes for a winning candidate, i.e. votes beyond those needed to win.
- Unproductive votes are either
STV Example
- Candidates O1, O2, and O3, of the Orange Party and G1, G2, and G3 of the Green Party run for three seats of an assembly.
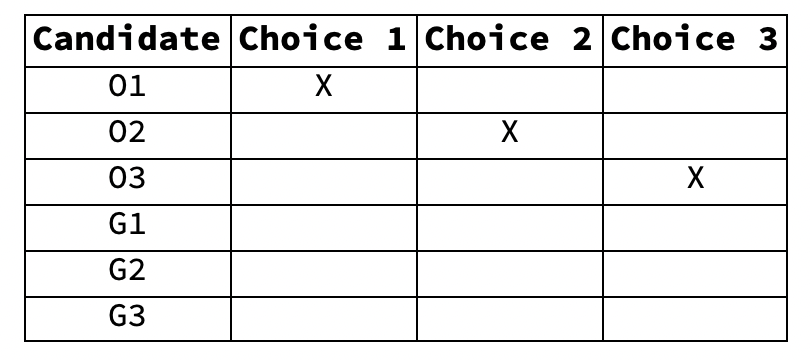
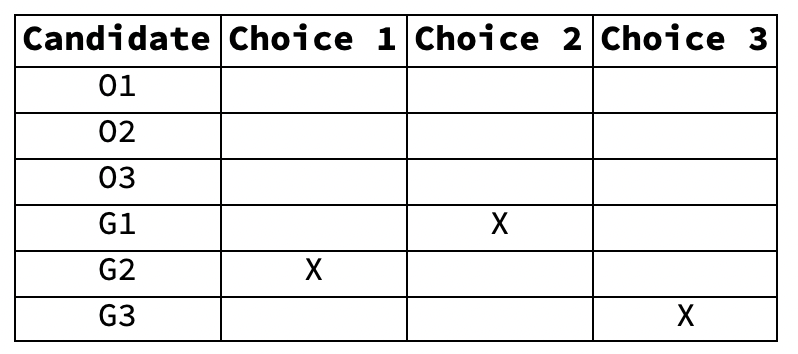
- 500 voters fill out ballots indicating their first, second, and third choices:
- The ballots like like this:

- A hypothetical ballot of an Orange Party voter is on the left. A Green Party ballot is on the right.
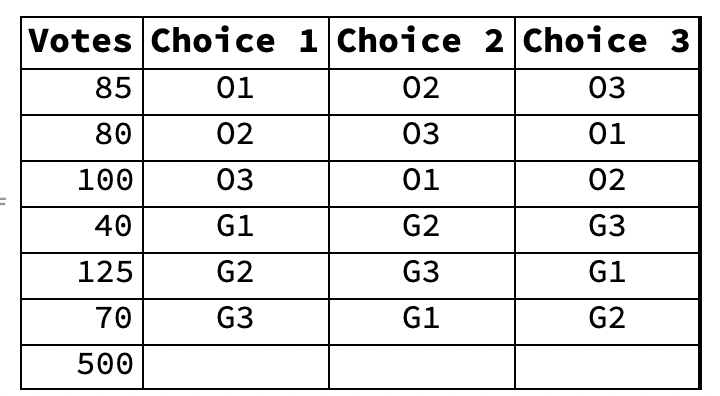
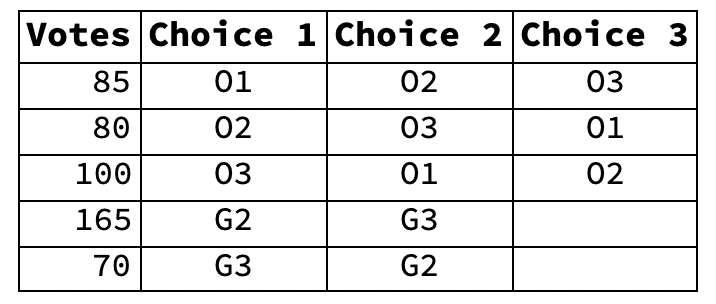
- Here’s a tally of the 500 ballots voters submitted:
- Ballot Spreadsheet #1
- Ballot Spreadsheet #1
- Here’s a flowchart of the STV process.
- Start Process
- Per the Start Rounded-Rectangle at the top of the flowchart we make a spreadsheet tallying the ballots. That’s Ballot Spreadsheet #1 above.
- Then we calculate the quota, the minimal number of votes needed to win a seat.
- The quota most widely used in STV calculations is the Droop Quota
- Droop Quota = (total votes / (number of seats + 1) ) + 1.
- The Droop Quota is a natural extension of a majority in an election for a single office.
- If there are 100 votes in a single-office election, for example, the Droop formula yields:
- Droop Quota = (100 / (1 + 1) ) + 1 = 51.
- If there are 100 votes in a single-office election, for example, the Droop formula yields:
- In our example there are 500 votes and 3 seats. So the quota is:
- Droop Quota = (500 / (3 + 1) ) + 1 = 126
- The quota most widely used in STV calculations is the Droop Quota
- We now follow the arrow to the Is-There-a-Winner Decision Diamond.
- Is-There-a-Winner Decision (1st Time)
- We ask whether any candidate meets the quota, i.e. has at least 126 votes. Scanning Ballot Spreadsheet #1 we see the answer is No. So we follow the No Arrow to the Loser Process Rectangle.
- Loser Process (1st Time)
- The Loser Process consists of
- Eliminating the candidate with the fewest votes
- Distributing his votes to his next choices.
- Updating the spreadsheet accordingly
- The lowest first-choice vote-getter on Ballot Spreadsheet #1 is G1. So we eliminate G1 from the spreadsheet, thus transferring his 40 votes to his second choice, G2. The result:
- Ballot Spreadsheet #2 (G1 loser)
- Ballot Spreadsheet #2 (G1 loser)
- We follow the arrow back to the Is-There-a-Winner Decision Diamond.
- The Loser Process consists of
- Is-There-a-Winner Decision (2nd Time)
- We ask whether there is any first-choice candidate on Ballot Spreadsheet #2 with at least 126 votes. This time the answer is Yes: G2 with 165 votes.
- So we follow the Yes Arrow to the Winner Process Rectangle.
- Winner Process (1st Time)
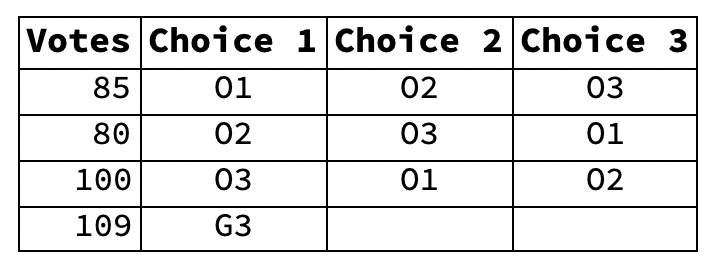
- G2 wins a seat and his 39 surplus votes (165 – 126) are transferred to his next choice, G3.
- The updated spreadsheet looks like this:
- Ballot Spreadsheet #3 (G2 winner, G1 loser)
- Ballot Spreadsheet #3 (G2 winner, G1 loser)
- We follow the arrow to the Are-All-Seats-Filled Decision Diamond.
- Are-All-Seats-Filled Decision (1st Time)
- Not all seats are filled. So we head to the Loser Process Rectangle.
- Loser Process (2nd Time)
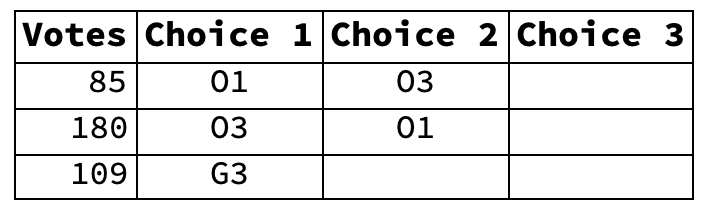
- We eliminate the lowest vote-getter, O2, transferring his 80 votes to O3. The spreadsheet now looks like this:
- Ballot Spreadsheet #4 (O2 loser, G2 winner, G1 loser)
- Ballot Spreadsheet #4 (O2 loser, G2 winner, G1 loser)
- We then follow the arrow to the Is-There-a-Winner Decision Diamond.
- We eliminate the lowest vote-getter, O2, transferring his 80 votes to O3. The spreadsheet now looks like this:
- Is-There-a-Winner Decision (3rd Time)
- Yes we have a winner: O3 with 180 votes.
- Winner Process (2nd Time)
- We transfer O3’s 54 surplus votes to O1. The spreadsheet now looks like this:
- Ballot Spreadsheet #5 (O3 winner, O2 loser, G2 winner, G1 loser)
- Ballot Spreadsheet #5 (O3 winner, O2 loser, G2 winner, G1 loser)
- We head back to the Are-All-Seats-Filled Decision Diamond.
- We transfer O3’s 54 surplus votes to O1. The spreadsheet now looks like this:
- Are-All-Seats-Filled Decision (2nd Time)
- We’ve filled two seats out of three. So we go to the Loser Process Rectangle .
- Loser Process (3rd Time)
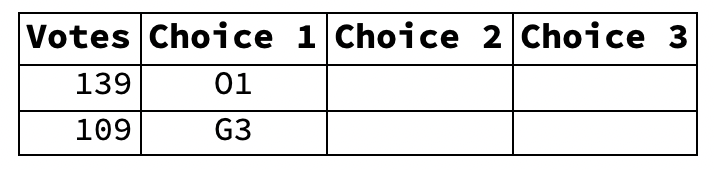
- We eliminate G3, whose votes go nowhere. The spreadsheet now looks like this.
- Ballot Spreadsheet #6 (G3 loser O3 winner, O2 loser, G2 winner, G1 loser)
- Ballot Spreadsheet #6 (G3 loser O3 winner, O2 loser, G2 winner, G1 loser)
- So we head back up to the Is-There-a-Winner Decision Diamond.
- We eliminate G3, whose votes go nowhere. The spreadsheet now looks like this.

- Is-There-a-Winner Decision (4th Time)
- We obviously have a winner.
- Winner Process (3rd Time)
- Our third and final winner is O1.
- Are-All-Seats-Filled Decision (3rd Time)
- Finally all seats are filled. So we go to the End Rounded-Rectangle.
- End Process
- We’re finished. The winners are: G2, O3, and O1.
- The entire process is summarized by displaying the votes of the first-choice candidates by round:
- Votes by Round
- Votes by Round
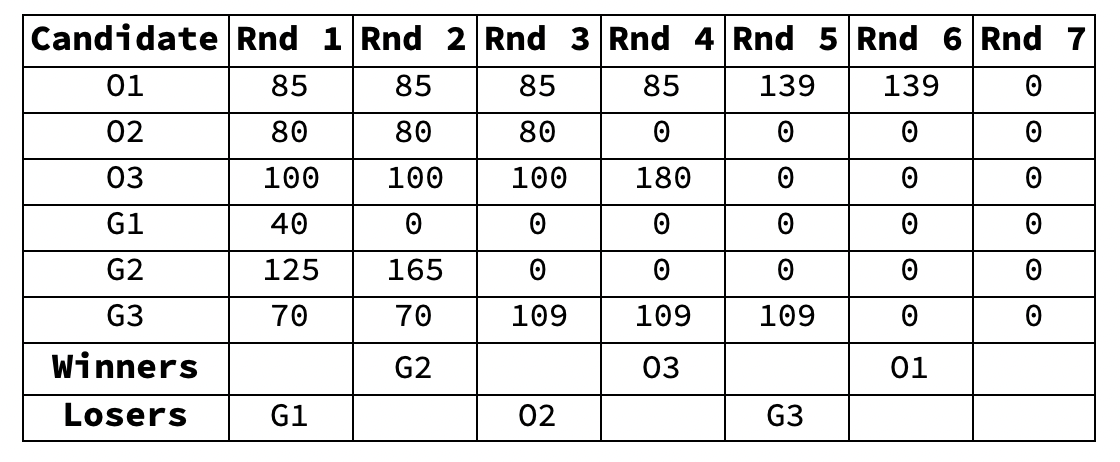
- Of the 500 ballots, 265 were for Orange candidates and 235 for Green candidates. Using a straightforward proportional algorithm, the vote totals would yield 2 seats for Orange and 1 for Green. STV generates the same result.
View Mathematica Program for STV
The Fundamental Problem with District Representation
- The fundamental problem with district representation is that a party can win a majority of the seats of a legislature without winning a majority of the votes.
- A simple example:
- A legislature consists of three seats, representing Districts 1, 2, and 3.
- An election is held. The results:
- In District 1, the Green Party candidate beats the Orange Party candidate 3 votes to 2.
- Likewise in District 2.
- In District 3, the Orange candidate beats the Green candidate 4 to 1.
- A bar chart of the results:
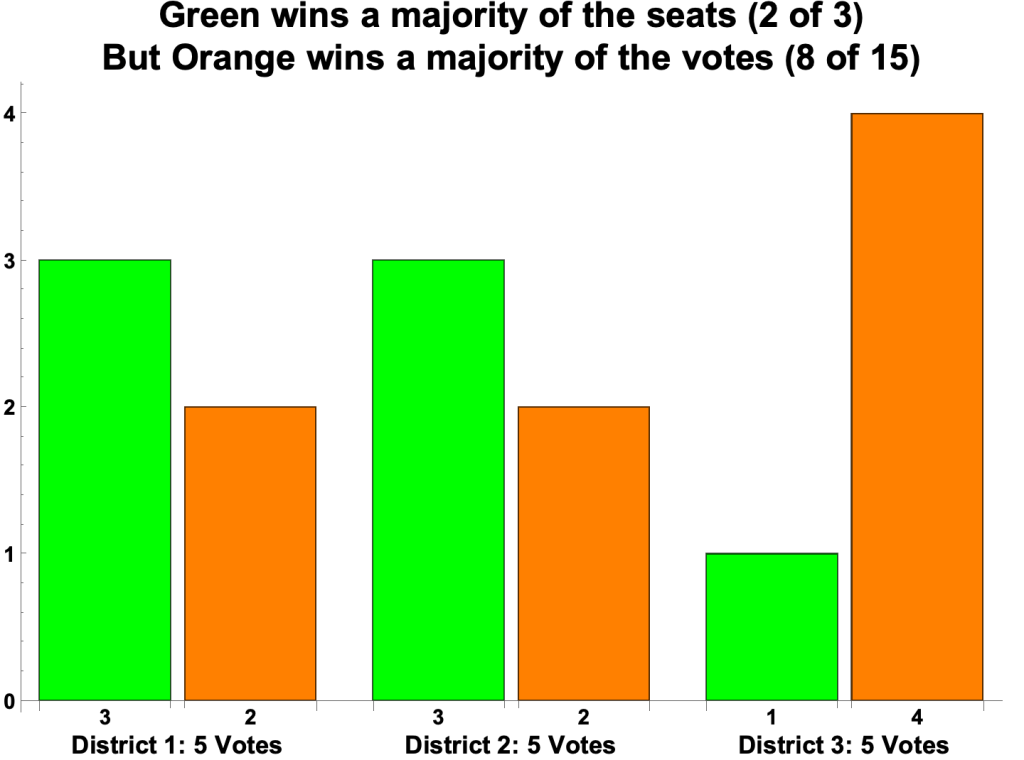
- In district representation, the proportion of seats a party wins depends not only on the proportion of votes it receives but also on how votes are distributed across electoral districts. For example, Green’s 7 and Orange’s 8 votes can be distributed so that it’s Orange that wins a majority of the seats.
View The Flaw of U.S. Electoral Systems
Links to Sites on Electoral Systems
- aceproject.org/ace-en/topics/es/esd/default
- ballotpedia.org/Electoral_system
- electoral-reform.org.uk/voting-systems/types-of-voting-system/
- fairvote.org/types_of_voting_systems
- sightline.org/2017/05/18/glossary-of-methods-for-electing-legislative-bodies/
- wikipedia.org/wiki/Electoral_system
- wikipedia.org/wiki/List_of_electoral_systems
Orange and Green Parties: Same Vote Totals, Five Different Outcomes
- The scenario:
- A small country of 500 citizens has a legislature of five seats, filled by elections conducted in five electoral districts of 100 members each. Two political parties, Orange and Green, compete in an election for the five seats. Orange candidates O1, O2, O3, O4, and O5 compete against Green candidates G1, G2, G3, G4, and G5 in Districts 1 through 5 respectively. In the election 265 citizens nationwide vote for Orange Party candidates and 235 citizens for Green Party candidates.
- The number of seats each party wins is limited, but not determined, by the parties’ total votes. The only limit is that Green cannot win all 5 seats. All other outcomes are possible. What determines the number seats among those outcomes is how “efficiently” each party’s votes are distributed across the districts.
- The bar charts below depict the five possible results, along with the number and proportion of wasted votes and the Efficiency Gap. A sixth bar chart depicts the result if proportional representation were used.
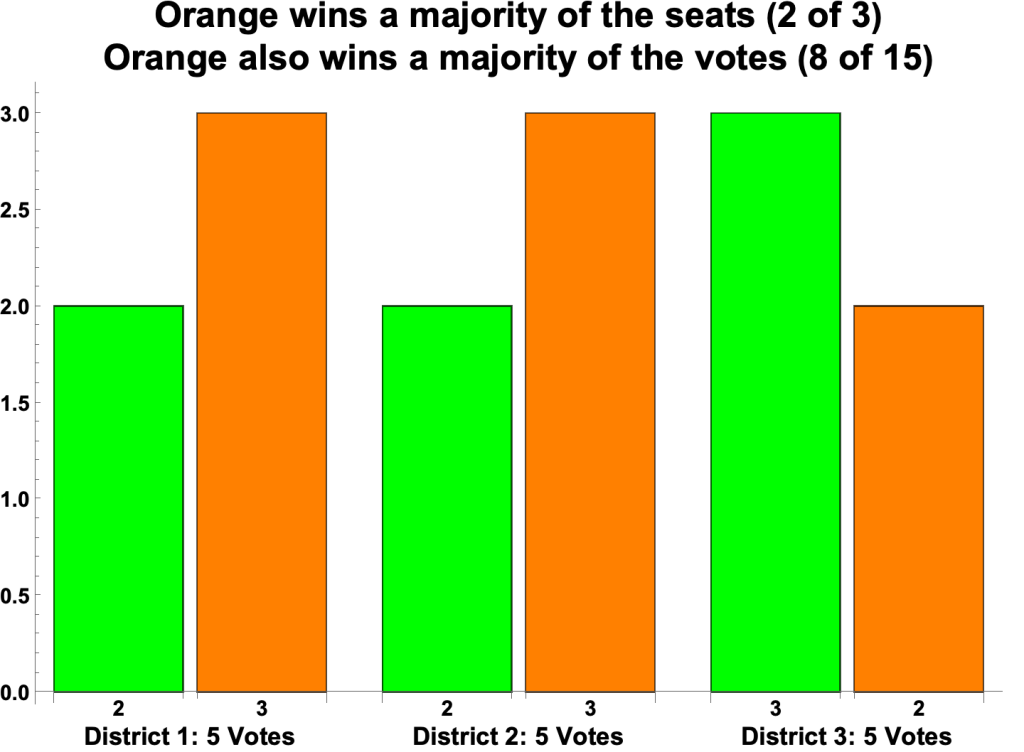
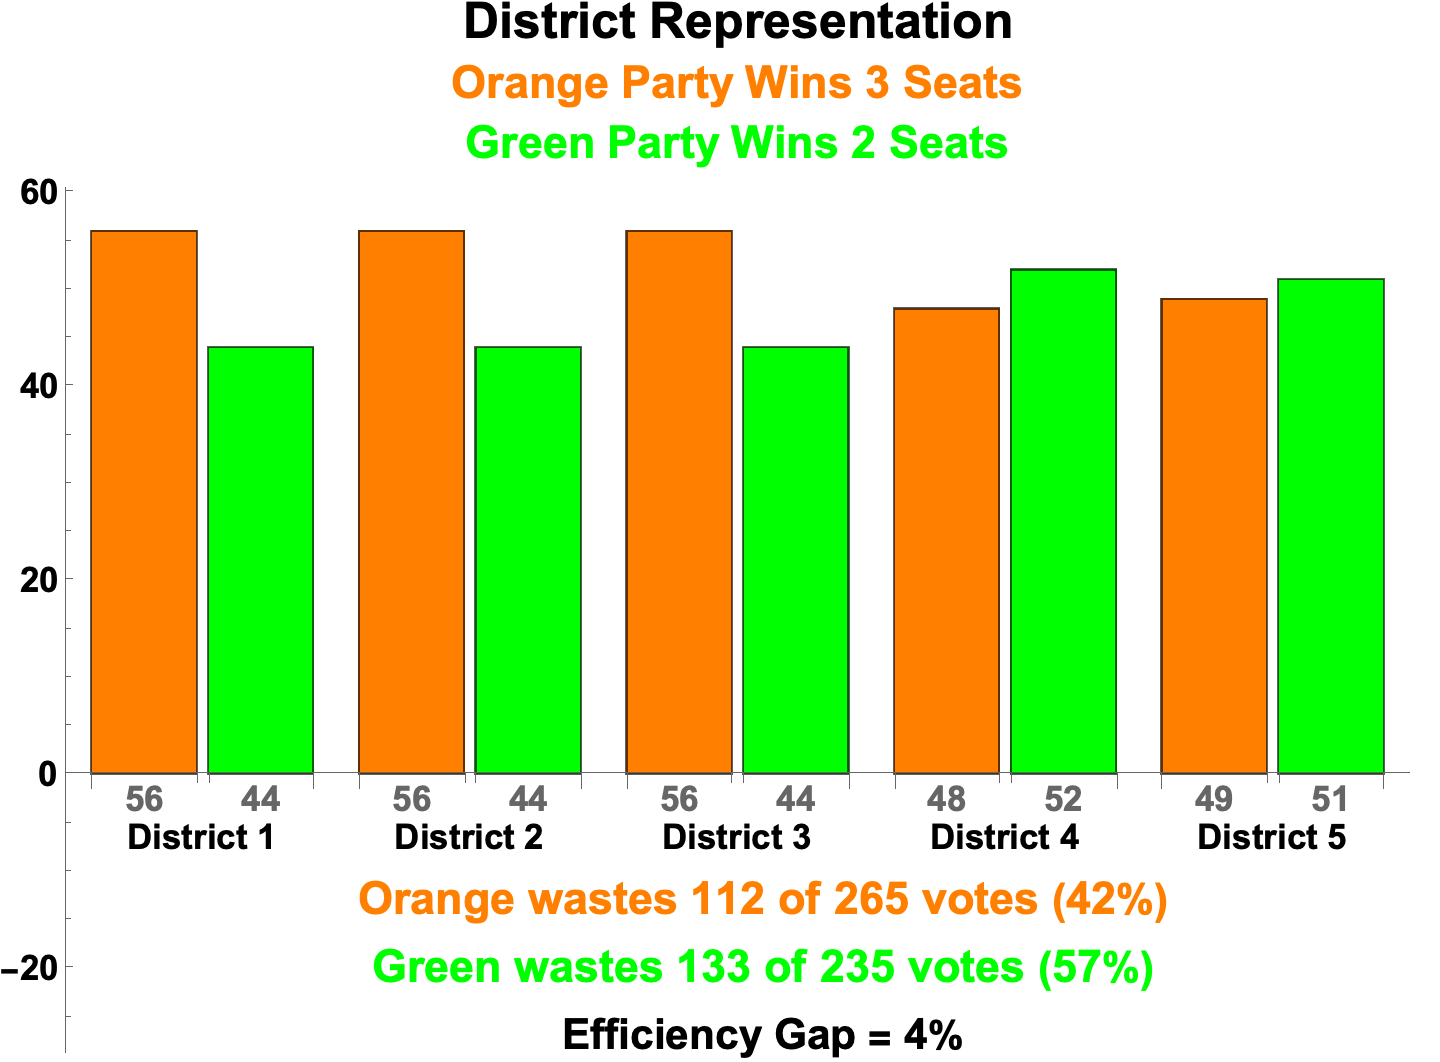
- It is of interest that the outcome with the the lowest Efficiency Gap—Orange 3 Seats, Green 2 Seats—is the same generated by proportional representation.
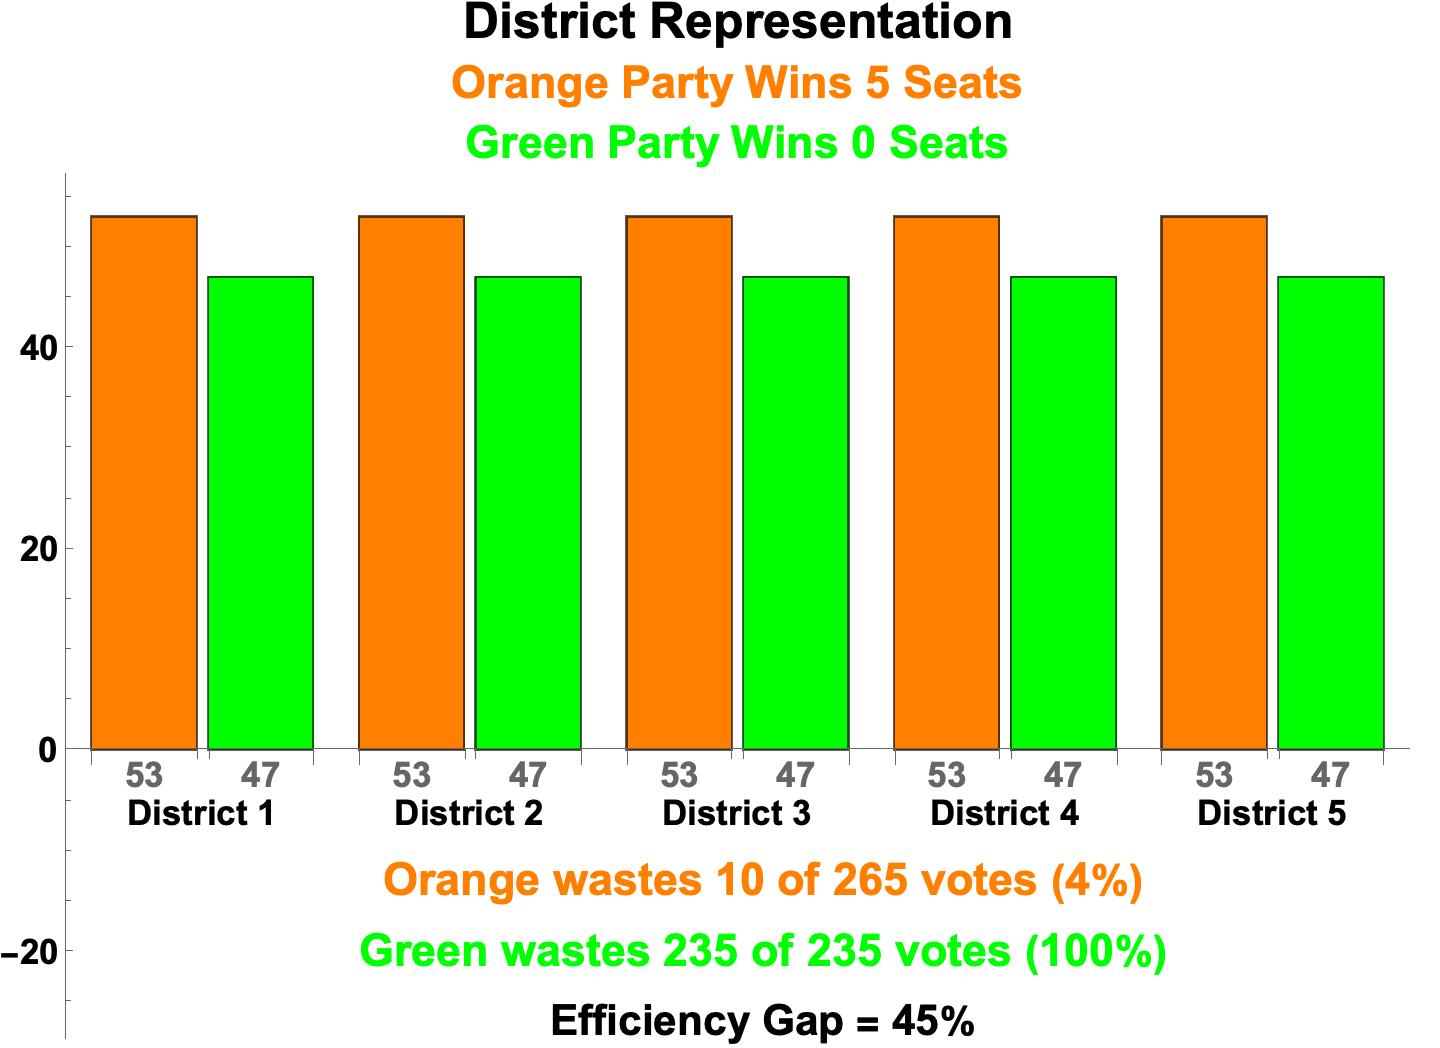
Orange 5, Green 0
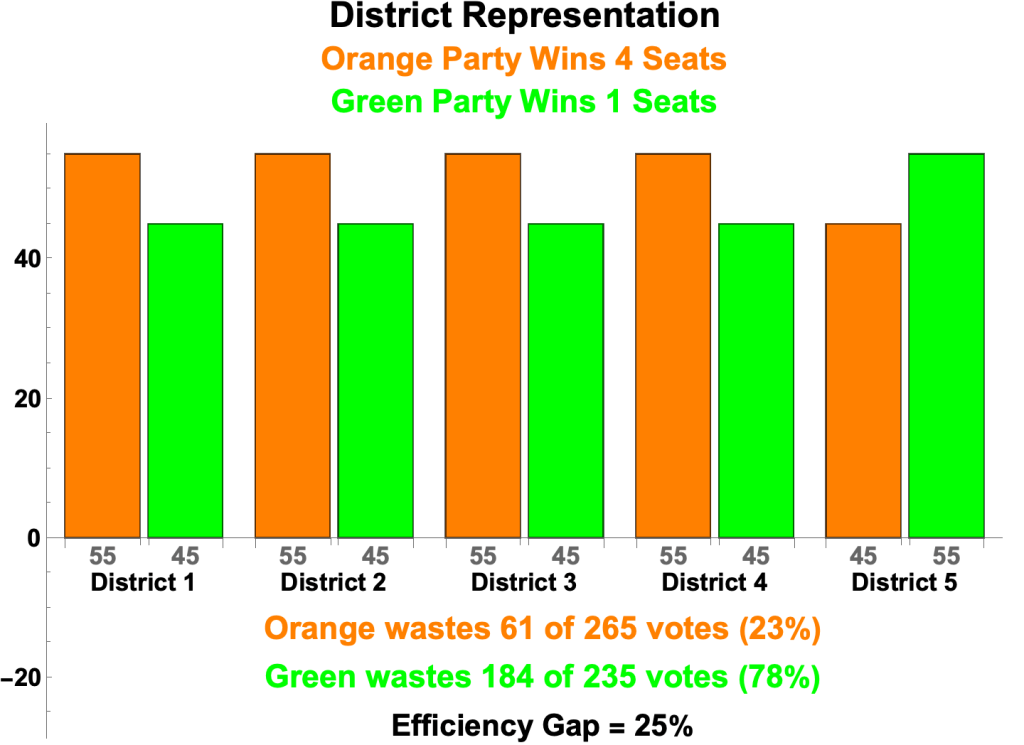
Orange 4, Green 1
Orange 3, Green 2
Orange 2, Green 3

Orange 1, Green 4

Proportional Representation
Wasted Votes and the Efficiency Gap
- Suppose two candidates compete in an election for a single office. The winner gets 60 of the 100 votes cast and the loser 40. Let M be the minimal number of votes guaranteeing victory in an election. Thus M = 51 in an election in which 100 votes are cast. The number of wasted votes in an election is defined as:
- the number of votes cast for the losing candidate + the number of votes cast for the winning candidate – M.
- In the example, the wasted votes consist of:
- the loser’s 40 votes
- the winner’s 9 “surplus” votes
- 60 – 51 = 9
- One party’s distribution of votes is more efficient than another’s if its percentage of wasted votes is less.
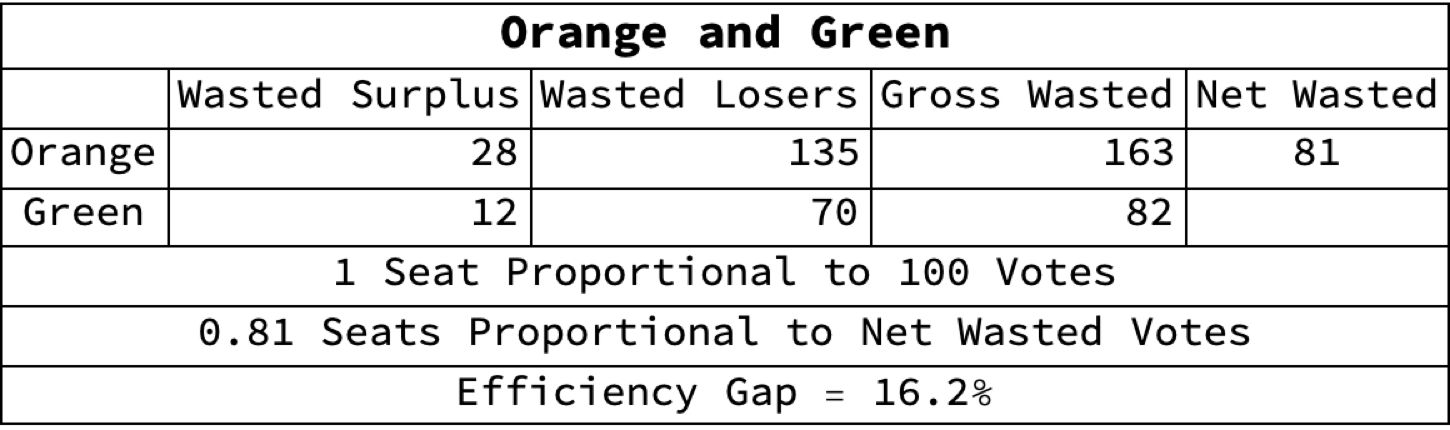
- For example, Orange and Green party voters cast 265 and 235 votes respectively across five 100-member districts as follows:
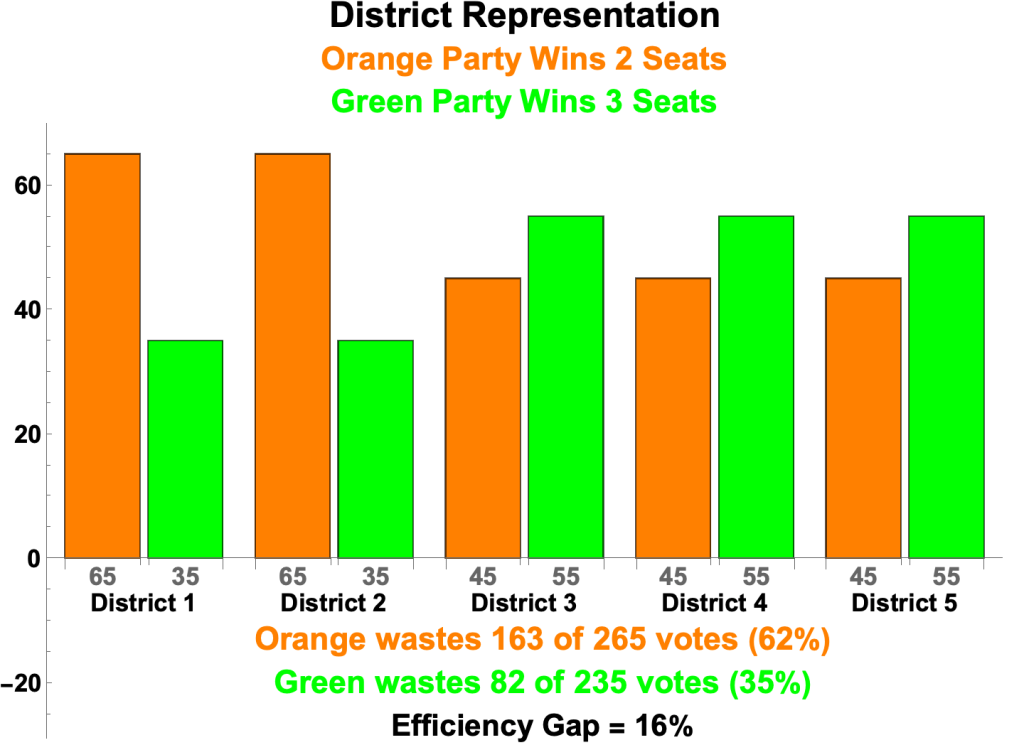
- Orange wastes 163 votes, consisting of:
- 14 surplus winning votes in each of Districts 1 and 2
- 65 – 51 = 14
- 45 losing votes in each of Districts 3, 4, and 5
- Which totals 14 x 2 + 45 x 3 = 163 wasted votes
- Thus, 62% of Orange’s 265 votes are wasted.
- 14 surplus winning votes in each of Districts 1 and 2
- Green wastes 82 votes, consisting of:
- 35 losing votes in each of Districts 1 and 2
- 4 surplus winning votes in each of Districts 3, 4, and 5
- 55 – 51 = 4
- Which totals 35 x 2 + 4 x 3 = 82 wasted votes
- Thus 35% of Green’s 235 votes are wasted.
- The distribution of Green’s votes across districts is thus more efficient than Orange’s.
- The number of wasted votes can be translated into the number of seats lost due to wasted votes. The translation goes like this:
- 1 seat is proportional to 100 votes
- Votes per seat = 500 votes / 5 seats = 100
- Orange wasted 81 more votes than Green
- Orange’s net wasted votes = Orange’s wasted votes – Green’s wasted votes = 163 – 82 = 81
- Therefore, Orange lost 0.81 seats because of wasted votes.
- 81 / 100 = 0.81
- 1 seat is proportional to 100 votes
- A useful notion in assessing the role of wasted votes in an election is the Efficiency Gap, developed by Nicholas Stephanopoulos and Eric McGhee:
- Efficiency Gap = (the number of one party’s wasted votes − the number of the other party’s wasted votes) / the total votes cast.
- The Efficiency Gap between Orange and Green is thus (163 – 82) / 500 = 16.2%
- The Efficiency Gap provides:
- a single number that characterizes the difference between parties’ wasted votes
- a quick way to translate wasted votes into lost seats
- Lost seats = the number of seats x the efficiency gap
- 0.81 = 5 x 0.162
- Lost seats = the number of seats x the efficiency gap
- Here’s a summary:
- Gerrymandering, Ranked Choice Voting, and Single Transferable Voting all use the concepts of productive and wasted vote counts
- In partisan gerrymandering one party weakens the voting power of another by drawing electoral boundaries so that the opposing party wastes a greater portion of its votes.
- In Ranked Choice Voting (unproductive) votes for losing candidates are transferred to voters’ backup choices.
- And in Single Transferable Voting (unproductive) surplus votes for winning candidates are transferred to voters’ backup choices, as well as votes for losing candidates.
One Person, One Vote
- One Person, One Vote is the principle that every vote should count the same — have the same weight, voting power, or effect on election results. One person’s vote should not count more than another’s, for example, because they’re more important, wealthier, more well known, better educated, or more knowledgable about the issues. Nor should their vote count more because of where they live.
- One Person, One Vote requires that electoral districts be approximately equal in population.
- Suppose, for example, a state had four electoral districts with 100, 200, 500, and 1,000 residents. As Chief Justice Earl Warren put it in Reynolds v. Sims:
- “The resulting discrimination against those individual voters living in disfavored areas is easily demonstrable mathematically. Their right to vote is simply not the same right to vote as that of those living in a favored part of the State. Two, five, or 10 of them must vote before the effect of their voting is equivalent to that of their favored neighbor. Weighting the votes of citizens differently, by any method or means, merely because of where they happen to reside, hardly seems justifiable.”
- “Whatever the means of accomplishment, the overriding objective must be substantial equality of population among the various districts, so that the vote of any citizen is approximately equal in weight to that of any other citizen in the State.”
- Warren’s argument is straightforward:
- The weight of a vote in an electoral district = 1 / the size of the district’s population.
- Therefore, votes in districts with unequal populations do not have the same weight.
- Or expressed as a “mathematical demonstration:”
- w1 = 1 / p1
- w2 = 1 / p2
- p1 ≠ p2
- Therefore, w1 ≠ w2.
- Suppose, for example, a state had four electoral districts with 100, 200, 500, and 1,000 residents. As Chief Justice Earl Warren put it in Reynolds v. Sims:
- Thus, the weight of a vote in a district with 100 residents is 1/100 and the weight of a vote with 200 residents is 1/200.
- From which it follows that a vote in the smaller district has twice the weight of vote in the larger.
- (1/100) / (1/200) = 2
- Put another way, one vote in the smaller district is equivalent to two in the larger.
- 1/100 = 1/200 + 1/200
- A corollary of One Person, One Vote is that groups with the same number of voters should have the same voting power. Such is not the case if districts have different population sizes. In the scenario depicted here the Orange Party’s 120 votes win one seat, but the Green Party’s 120 votes win four, giving them control of the five-member legislature.
- Bar Chart:
- If districts differ in the number of their constituents, some groups of voters command more votes in the legislature than other groups of the same size.

