Contents
- Three Democratic Norms
- The Flaw of District Representation
- Effect on the House, Senate, and Electoral College
- Addendum
- Detailed Table of Contents
Three Democratic Norms
- The electoral system underlying elections for the House, Senate, and Presidency violates three basic democratic norms:
- No candidate should win an election if another candidate received more votes.
- No party should win the majority of seats in a legislature if another party got more votes.
- Every vote should count the same
- For example:
- In the 2016 Presidential election, Hillary Clinton received 51.11% of the Clinton-Trump popular vote, but Donald Trump won 57.25% of the electoral votes (304 to 227) and became president, violating the first norm.
- In the 2012 House election, Democrats received 50.58% of the two-party vote, but Republicans won 53.79% of the seats (234 to 201) and controlled the House, violating the second norm.
- In Senate elections, a vote for Senator in Wyoming counts 68 times more than a vote for Senator in California, violating the third norm.
The Flaw of District Representation
- The two most widely-used electoral systems for electing a legislature are Proportional and District Representation.
- In Proportional Representation, a party’s proportion of seats equals the proportion of votes it receives.
- In District Representation, a party’s proportion of seats equals the proportion of district elections its candidates win.
- The electoral system underlying elections for the House, Senate, and Presidency is District Representation.
- District Representation has a fundamental flaw:
- A party’s proportion of seats is determined in part by its proportion of votes but also in part by how its votes are distributed across electoral districts. Therefore:
- A party’s proportion of seats can differ from its proportion of votes. In the extreme, the distribution of votes results in a party’s winning the majority of seats (or electors) without winning a majority of votes.
- Anything that affects the distribution of votes can affect the proportion of seats parties win, e.g. gerrymandering.
- A party’s proportion of seats is determined in part by its proportion of votes but also in part by how its votes are distributed across electoral districts. Therefore:
- There are two mechanisms by which a party’s distribution of votes can affect the number of seats it wins:
- How “efficiently” its votes are distributed across electoral districts.
- The extent that its votes are cast in districts with fewer voters.
Vote Efficiency Mechanism
- Here’s an hypothetical example of Vote Efficiency affecting the proportion of seats the parties win.
- A legislature consists of three seats, representing Districts 1, 2, and 3.
- An election is held. The results:
- In District 1, the Green Party candidate beat the Orange Party candidate 3 votes to 2.
- The same in District 2.
- In District 3, the Orange candidate beat the Green candidate 4 votes to 1.
- A bar chart of the results:

- One party’s distribution of votes is more efficient than another’s if it “wastes” fewer votes.
- Let M be the minimal number of votes guaranteeing victory in an election. Thus M = 3 in an election in which five votes are cast.
- The number of wasted votes in an election is defined as:
- the number of votes cast for the losing candidate + the number of votes cast for the winning candidate – M.
- In the example, Green wasted only 1 vote across the three district elections.
- District 1: 0 surplus winners in District 1, where M = 3
- District 2: 0 surplus winners
- District 3: 1 loser
- But Orange wasted votes 5 votes
- District 1: 2 losers
- District 2: 2 losers
- District 3: 1 surplus winner (4 – 3)
- Despite getting fewer votes, Green won more seats because the distribution of its votes was more efficient.
- Given the same total votes (Green 7 and Orange 8), a different distribution of votes would have resulted in Orange winning a majority of seats.

- In this scenario Orange has the more efficient distribution of votes.
- Green = 4 wasted votes
- District 1: 2 losers
- District 2: 2 losers
- District 3: 0 surplus winners
- Orange = 2 wasted votes
- District 1: 0 surplus winners
- District 2: 0 surplus winners
- District 3: 2 losers
- Green = 4 wasted votes
Unequal Population Mechanism
- Here’s a hypothetical example of Unequal Populations affecting the proportion of seats the parties win.
- In the scenario, Green wins two seats by winning the two smaller districts despite Orange beating Green 12 votes to 11 overall,

- Wasted votes are not a factor since Green and Orange waste the same number of votes, 5.
- Green:
- District 1: 0 surplus winners
- District 2: 0 surplus winners
- District 3: 5 losers
- Orange:
- District 1: 2 losers
- District 2: 2 losers
- District 3: 1 surplus winner, where M = 7
- Green:
Effect on the House, Senate, and Electoral College
- In District Representation, the number of seats a party wins can be affected by the distribution of votes cast across districts.. Elections for the House, Senate, and Electoral College all use District Representation. Therefore, the number of seats or electors a party wins in the House, Senate and Electoral College can be affected by how votes are distributed across congressional districts and states.
The House
- Democrats Got More Votes but Republicans Got More Seats
- Unequal Populations Not a Factor
- Gerrymandering
- Geographic Sorting
- In House elections:
- A party can win a majority of seats without winning a majority of votes.
- The distribution of votes affects election results primarily through Vote Efficiency. Unequal Populations play virtually no role.
- A political party can change the distribution of votes across districts by gerrymandering and thus affect the number of seats it wins without increasing its vote share.
- The distribution of votes across districts is affected by geographic sorting.
Democrats Got More Votes but Republicans Got More Seats
- In the 2012 House election, Democrats received 50.58% of the two-party vote, but Republicans won 53.79% of the seats (234 to 201) and controlled the House, violating the second norm.
Unequal Populations Not a Factor
- In Wesberry v. Sanders (1964) the Supreme Court ruled that congressional districts must be approximately equal in population, virtually nullifying the effect on election results of the distribution of votes across districts with different numbers of voters. Congressional districts are nicely distributed around an average of 350,000 residents.

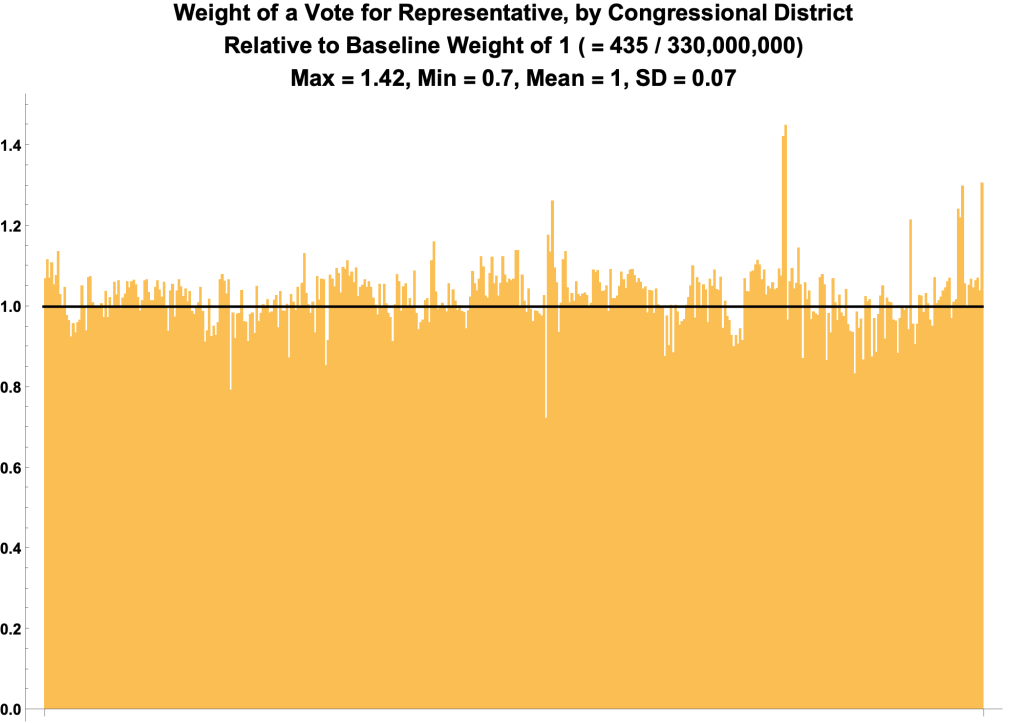
- The weight of a vote for a Representative varies little across congressional districts.
Gerrymandering
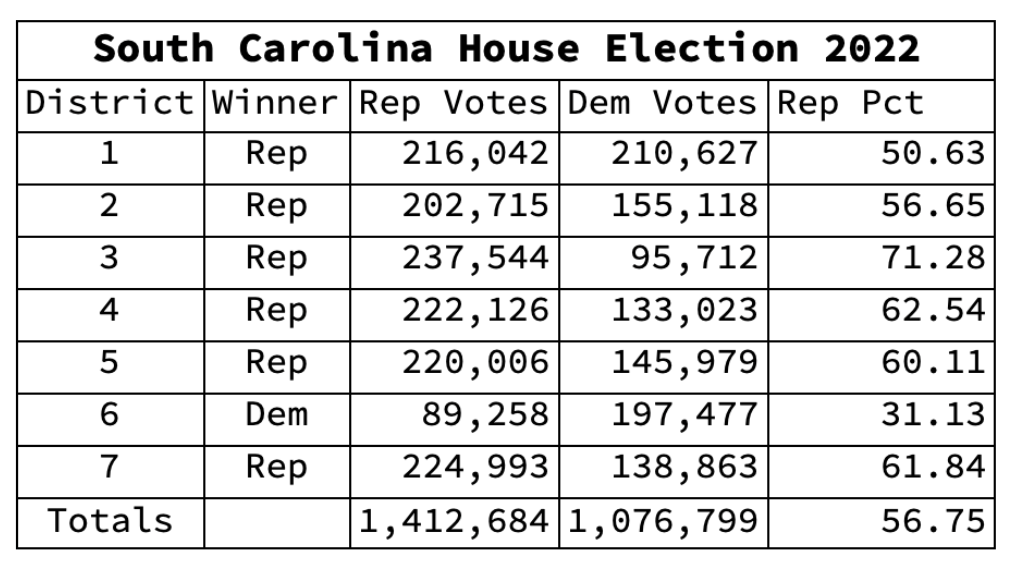
- The Constitution gives states power over elections, including drawing the boundaries of congressional districts. A party in control of a state legislature is thus able to alter the distribution of votes across congressional districts by drawing boundaries that result in more wasted votes for the opposing party.
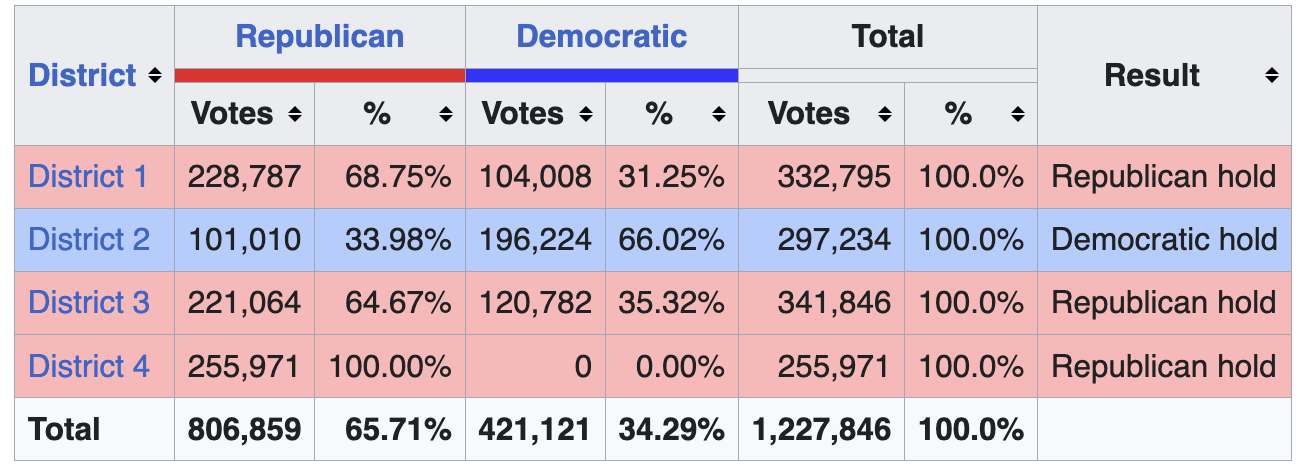
- In the 2022 House election in South Carolina, for example, Republicans got 56.75% of the two-party vote and won 85.7% of the seats.
More on Gerrymandering
Geographic Sorting
- The distribution of votes across congressional districts is affected by geographic sorting, a causal connection between a group’s political views and where they live. Democrats, for example, tend to live in denser areas than Republicans, clustering in congressional districts encompassing large cities.
View Articles on Partisan Rural-Urban Divide
The Senate
- Majority of Seats, Minority of Votes
- Senate’s Small-State Bias
- Senate’s Partisan Small-State Bias
- One Person, Not One Vote in Senate Elections
- In Senate elections:
- A party can win a majority of seats without winning a majority of votes.
- The distribution of votes across states with unequal populations is a significant factor in determining the proportion of seats each party wins. The Senate has a small-state bias.
- The distribution of votes across states is affected by geographic sorting, resulting in the Senate’s partisan small-state bias.
- Votes for Senator in less populated states count more than votes for Senator in more populated state, violating the principle of One Person, One Vote.
Majority of Seats, Minority of Votes
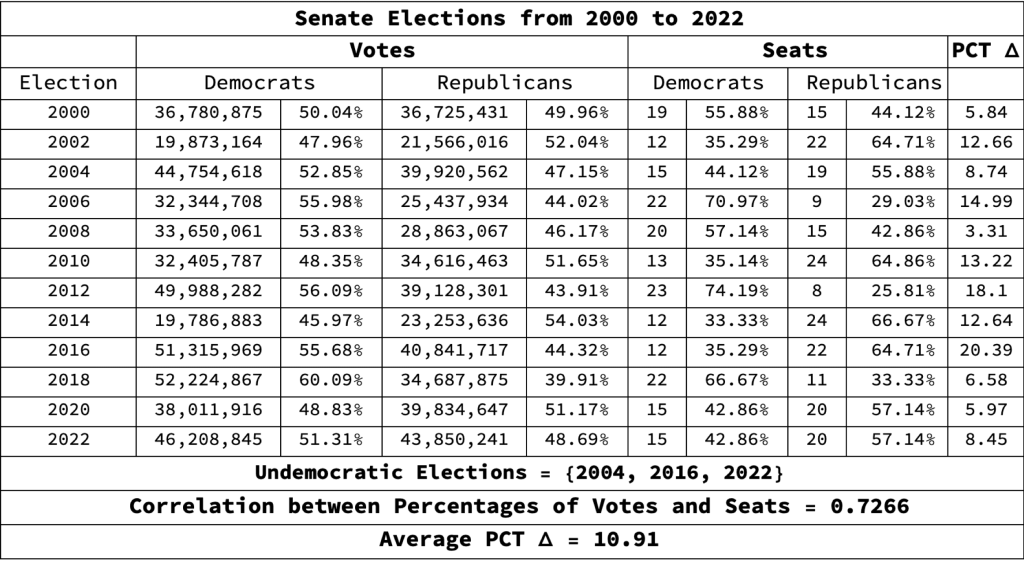
- In the three elections for the Senate of 116th Congress (2019–2021), Democrats received 56% of the two-party vote, but Republicans won 53 seats and controlled the Senate.
- View The Senate of the 116th Congress
Senate’s Small-State Bias
- The Senate’s small-state bias in terms of population:

- The Senate’s small-state bias in terms of votes cast.

View Senate Skews towards Rural Voters, per Nate Silver
Senate’s Partisan Small-State Bias

One Person, Not One Vote in Senate Elections
- One Person, One Vote is the principle that every vote should count the same — have the same weight, voting power, or effect on election results. One person’s vote should not count more than another’s, for example, because they’re more important, wealthier, more well known, better educated, or more knowledgable about the issues. Nor should their vote count more because of where they live.
- One Person, One Vote requires that electoral districts be approximately equal in population.
- Suppose, for example, a state had four electoral districts with 100, 200, 500, and 1,000 residents. As Chief Justice Earl Warren put it in Reynolds v. Sims:
- “The resulting discrimination against those individual voters living in disfavored areas is easily demonstrable mathematically. Their right to vote is simply not the same right to vote as that of those living in a favored part of the State. Two, five, or 10 of them must vote before the effect of their voting is equivalent to that of their favored neighbor. Weighting the votes of citizens differently, by any method or means, merely because of where they happen to reside, hardly seems justifiable.”
- “Whatever the means of accomplishment, the overriding objective must be substantial equality of population among the various districts, so that the vote of any citizen is approximately equal in weight to that of any other citizen in the State.”
- Warren’s argument is straightforward:
- The weight of a vote in an electoral district = 1 / the size of the district’s population.
- Therefore, votes in districts with unequal populations do not have the same weight.
- Or expressed as a “mathematical demonstration:”
- w1 = 1 / p1
- w2 = 1 / p2
- p1 ≠ p2
- Therefore, w1 ≠ w2.
- Suppose, for example, a state had four electoral districts with 100, 200, 500, and 1,000 residents. As Chief Justice Earl Warren put it in Reynolds v. Sims:
- Thus, the weight of a vote in a district with 100 residents is 1/100 and the weight of a vote with 200 residents is 1/200.
- From which it follows that a vote in the smaller district has twice the weight of vote in the larger.
- (1/100) / (1/200) = 2
- Put another way, one vote in the smaller district is equivalent to two in the larger.
- 1/100 = 1/200 + 1/200
- A corollary of One Person, One Vote is that groups with the same number of voters should have the same voting power. Such is not the case if districts have different population sizes. In the scenario depicted here the Orange Party’s 120 votes win one seat, but the Green Party’s 120 votes win four, giving them control of the five-member legislature.
- Bar Chart:
- If districts differ in the number of their constituents, some groups of voters command more votes in the legislature than other groups of the same size.

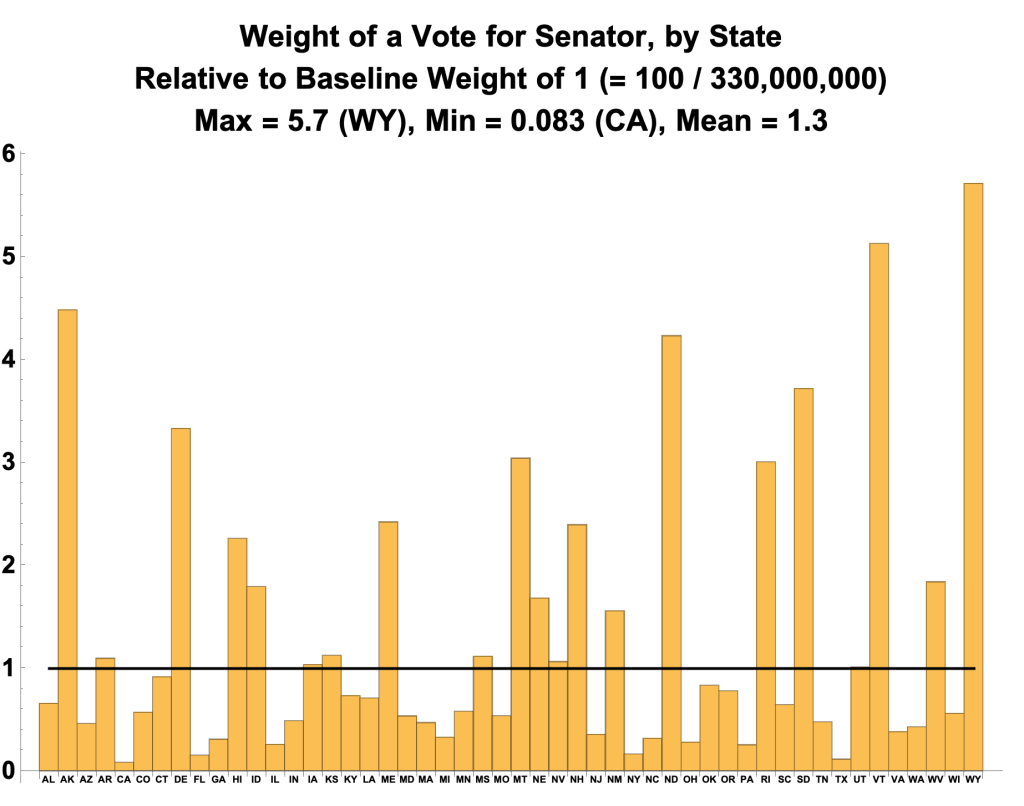
- The weight of a vote for Senator in a state = 1 / the state’s population.
- State populations differ, from 1/2 million in Wyoming to 39 million in California.
- Therefore, the weight of a vote for Senator differs from state to state.
- In the extreme, the weight of a vote for Senator in Wyoming is 68 times that of a vote for Senator in California,
- 5.7 / 0.083 = 68.67
- If every vote for Senator had the same weight, a smaller group of voters would not be able to elect more Senators than a larger group.
- A Democratic senator of the 116th Congress was elected by a total of 12,244,176 votes, Kamala Harris.
- But 28 Republican Senators in the same Congress were elected by fewer votes, 11,532,187.
- Barrasso (WY), Boozman (AR), Capito (WV), Cassidy (LA), Cochran (MS), Collins (ME), Cotton (AR), Cramer (ND), Crapo (ID), Daines (MT), Enzi (WY), Ernst (IA), Fischer (NE), Graham (SC), Hoeven (ND), Inhofe (OK), Kennedy (LA), Lee (UT), Moran (KS), Murkowski (AK), Risch (ID), Roberts (KS), Romney (UT), Rounds (SD), Sasse (NE), Sullivan (AK), Thune (SD), Wicker (MS).
- View Details
Electoral College
- Presidents Who Didn’t Receive the Most Votes
- Why Proportions of Electoral and Popular Votes Differ
- One Person, Not One Vote in Presidential Elections
- In presidential elections
- A candidate can win a majority of electoral votes and become president without winning a majority of popular votes.
- A candidate’s proportion of electoral votes differs from their proportion of the popular vote because of (1) the way states award their electoral votes to candidates and (2) the way the Constitution allocates electoral votes to states.
- Votes for president in smaller states count more than votes for president in larger states
Presidents Who Didn’t Receive the Most Votes
- Four presidents have been elected though not getting the most votes:
- Rutherford B. Hayes in 1876
- Benjamin Harrison in 1888
- George W. Bush in 2000
- Al Gore received 50.27% of the Gore-Bush popular vote, but Bush won 50.47% of the electoral votes (271 to 266).
- Donald Trump in 2016.
- Hillary Clinton received 51.11% of the Clinton-Trump popular vote, but Donald Trump won 57.25% of the electoral votes (304 to 227)
Why Proportions of Electoral and Popular Votes Differ
- A candidate’s proportion of electoral votes differs from their proportion of the popular vote because of (1) the way states award their electoral votes to candidates and (2) the way the Constitution allocates electoral votes to states.
- The first problem, that the “winner takes all” in 48 states, is well-known.
- What’s not so well known is the second problem.
- Al Gore received more votes in the 2000 presidential election but lost to Bush 267 to 271 electoral votes. Had states’ electoral votes been awarded to candidates in proportion to the popular vote, Bush still would have won, 269.232 electoral votes to 268.768. The reason is that the number of electoral votes per so many votes varies from state to state. For details:
One Person, Not One Vote in Presidential Elections
- The weight of a vote for a presidential elector in a state = the number of the state’s electors / the state’s population.
- States differ in population.
- Therefore the weight of a vote for a presidential elector differs from state to state.

More on the Electoral College
Addendum
- House Basics
- Senate Basics
- Electoral College Basics
- Senate Skews towards Rural Voters, per Nate Silver
- A group of 39 million Americans is represented by two Senators. A group of 38 million Americans is represented by 42
- Articles on Partisan Rural-Urban Divide
- The Senate of the 116th Congress
- 28 Republican Senators of the 116th Congress Elected by Fewer Votes than Kamala Harris Alone
- Bar Chart of Weight of a Vote for a Representative
- Percentage of Votes versus Percentage of Seats in House Elections from 2000 to 2022
- Percentage of Votes versus Percentage of Seats in Senate Elections from 2000 to 2022
- Percentage of Votes versus Percentage of Electors in Presidential Elections from 2000 to 2020
- Computer Simulations
- Detailed Table of Contents
House Basics
- The House has 435 seats, per the 1929 Permanent Apportionment Act
- Apportionment
- Each state is apportioned a subset of 435 House seats in proportion to its share of the population of the 50 states, per the decennial census.
- The algorithm is explained in Computing Apportionment.
- Each state is guaranteed at least one seat.
- Reapportionment takes effect three years after the census
- California has the most representatives, 53. Seven states have 1 representative.
- Each state is apportioned a subset of 435 House seats in proportion to its share of the population of the 50 states, per the decennial census.
- State legislatures draw the boundaries that define the congressional districts for its allotted number representatives.
- All states except four use plurality voting for electing their representatives
- Georgia and Louisiana use majority voting.
- Maine and Alaska use ranked choice voting.
- The House provides equal representation for congressional districts, that is, each district has one seat. Since districts are approximately equal in population, thanks to the Supreme Court, each member of the House represents about the same number of people.
- One Person, One Vote
- One Person, One Vote is the principle (not in the Constitution) that every person’s vote should count the same, i.e. should have the same weight or voting power.
- In Wesberry v. Sanders (1964), the Supreme Court ruled that One Person, One Vote applied to congressional districts, requiring that districts be approximately equal in population. As a result, votes today in House elections have about the same weight.
- One Person, One Vote
- Contiguity and Compactness
- 34 states require that their congressional districts be contiguous, i.e. a person can travel from any point in the district to any other point without having to cross a different district.
- 31 states require that their congressional districts be compact, i.e. not spread out, more like a circle than an elongated ellipse.
Senate Basics
- The Senate provides equal representation to the states, two Senators per state. States of course differ in the size of their populations, from Wyoming at 581,381 to California at 39,029,342. Thus, unlike representatives in the House, Senators represent different numbers of people.
- Senate representation results from a compromise at the Constitutional Convention:
- Failed Virginia (Large State) Plan
- Congress should be bicameral, with the number of a state’s representatives in each chamber proportional to its population.
- Failed New Jersey (Small State) Plan
- Congress should have one chamber, with each state having the same number of representatives.
- Grand (Connecticut) Compromise
- A state’s representation in the House is proportional to its population.
- In the Senate every state has the same number of representatives, two.
- View Malapportioned Senate, from Tyranny of the Minority
- Failed Virginia (Large State) Plan
- Per Article 1, Section 3, Clause 2, Senate elections take place every two years in three classes.
- Class 1: 33 seats
- Class 2: 33 seats
- Class 3: 34 seats
- Like the House, all states except four use plurality voting for their Senators
- Georgia and Louisiana use majority voting.
- Maine and Alaska use ranked choice voting.
- Senators were initially chosen by state legislatures.
- Constitution: Article I, Section 3, Clause 1
- “The Senate of the United States shall be composed of two Senators from each state, chosen by the legislature thereof, for six years; and each Senator shall have one vote.”
- Constitution: Article I, Section 3, Clause 1
- Since 1913 they’ve been elected by the people.
- Seventeenth Amendment (1913)
- “The Senate of the United States shall be composed of two Senators from each State, elected by the people thereof, for six years; and each Senator shall have one vote.”
- Seventeenth Amendment (1913)
Electoral College Basics
- The President and Vice President are elected by the 538 electors of the Electoral College rather than directly by the people. Each elector has one vote.
- Article II, Section 1 of the Constitution:
- Each State shall appoint, in such Manner as the Legislature thereof may direct, a Number of Electors, equal to the whole Number of Senators and Representatives to which the State may be entitled in the Congress
- Thus,
- a state gets n electors, n being the total number of its Senators and Representatives
- a state’s legislature can choose its electors any way it wants.
- The 23rd Amendment (1961) allocates to the District of Columbia the number of electors equal to the number of the least-populated state, meaning 3 electors.
- The total number of electors is therefore 100 + 435 + 3 = 538
- To win, a candidate needs a majority of the electoral votes, 270.
- The states gradually transitioned from their legislatures choosing electors to election of electors by popular vote. (Wikipedia):
- Initially, state legislatures chose the electors in most states.
- By 1824, there were six states whose legislatures selected electors.
- By 1832, only South Carolina selected electors by legislature vote.
- Since 1864, electors in every state have been chosen based on the popular vote.
- The winner of a state’s popular vote gets all its electoral votes, with two exceptions.
- Maine and Nebraska allocate one electoral vote to the winner of each House district and two electoral votes to the statewide winner.
- Four presidents (so far) have been elected though losing the popular vote.
- Rutherford B. Hayes in 1876
- Benjamin Harrison in 1888
- George W. Bush in 2000
- Donald Trump in 2016.
- At the Constitutional Convention, delegates considered three ways of selecting the President:
- Congress would choose the president, like a parliament electing a prime minister.
- The people would choose the president, by popular vote.
- A counsel of electors appointed by the states would choose the president, like the College of Cardinals choosing the pope.
- Having rejected the first two options, the Electoral College was the only option left.
Senate Skews towards Rural Voters, per Nate Silver
The Senate has a major skew towards rural voters, Nate Silver FiveThirtyEight
- At FiveThirtyEight, our favorite way to distinguish between urban and rural areas is based on using census tracts to estimate how many people live within a 5-mile radius of you. Based on this, we can break every person in the country down into four buckets:
- Rural: Less than 25,000 people live within a 5-mile radius of you;
- Exurban or small town: Between 25,000 and 100,000 people within a 5-mile radius;
- Suburban or small city: Between 100,000 and 250,000 people within a 5-mile radius;
- Urban core or large city: More than 250,000 people within a 5-mile radius.
- As it happens, the overall U.S. population (including Washington D.C. and Puerto Rico) is split almost exactly evenly between these buckets:
- 25 percent rural,
- 23 percent exurban/small town,
- 27 percent suburban/small city, and
- 25 percent urban core/large city.
- But what does representation look like in the Senate? Since each state has the same number of senators, this is simple to calculate. We can take the urban/rural breakdown for each state and average the 50 states together, as in the table below:
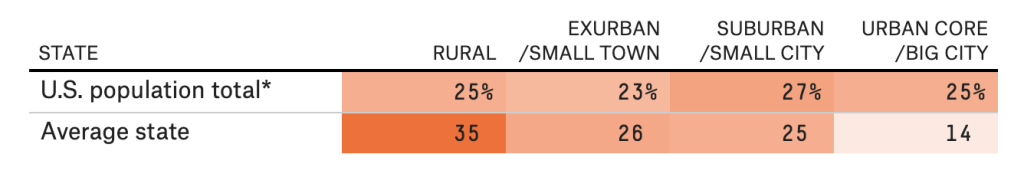
- Because there are a lot of largely rural, low-population states, the average state — which reflects the composition of the Senate — has 35 percent of its population in rural areas and only 14 percent in urban core areas, even though the country as a whole — including dense, high-population states like New York, Texas and California — has about 25 percent of the population in each group. That’s a pretty serious skew. It means that the Senate, de facto, has two or three times as much rural representation as urban core representation … even though there are actually about an equal number of voters in each bucket nationwide.
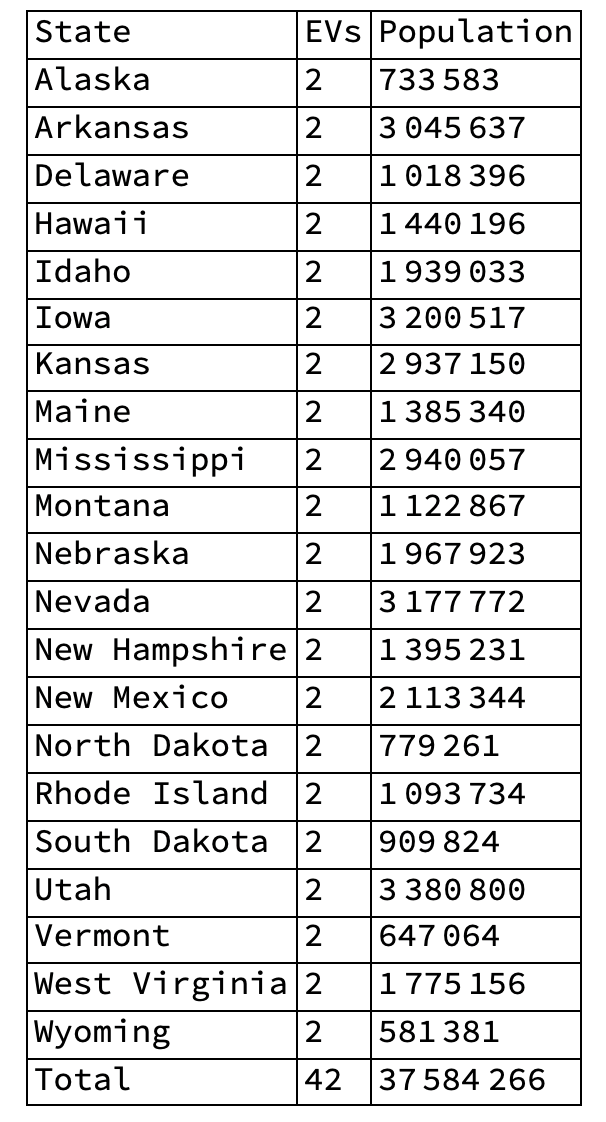
A group of 39 million Americans is represented by two Senators. A group of 38 million Americans is represented by 42
- The population of California is 39,029,342, which is greater than the total population of the 21 smallest states:
- Based on The challenge to democracy—overcoming the small state bias, July 2022 Brookings Institute
Articles on Partisan Rural-Urban Divide
- The Growing Rural-Urban Political Divide and Democratic Vulnerability, Suzanne Mettler and Trevor Brown
- journals.sagepub.com/doi/10.1177/00027162211070061
- Throughout American history and as recently as the early 1990s, each of the major political parties included both rural and some urban constituencies, but since then the nation has become deeply divided geographically. Rural areas have become increasingly dominated by the Republican Party and urban places by the Democratic Party. This growing rural-urban divide is fostering polarization and democratic vulnerability. We examine why this cleavage might endanger democracy, highlighting various mechanisms: the combination of long-standing political institutions that give extra leverage to sparsely populated places with a transformed party system in which one party dominates those places; growing social divergence between rural and urban areas that fosters “us” versus “them” dynamics; economic changes that make rural areas ripe for grievance politics; and party leaders willing to cater to such resentments.
- Our urban/rural political divide is both new — and decades in the making, Guian McKee
- washingtonpost.com/outlook/2021/10/08/our-urban-rural-political-divide-is-both-new-decades-making/
- The 2020 election revealed a stark divide between rural and small-town voters — who overwhelmingly supported Republicans — and those in cities and suburbs, who favored Democrats.
- Today’s blue/red divide then plays out not between regions — as we saw in the famous 2000 electoral map, which introduced the concept of such divisions and pitted red states vs. blue ones — but between metropolitan and rural areas within states.
- As New Census Numbers Show, the Biggest Divide Isn’t North v. South Anymore—It’s Metro v. Rural, David A. Hopkins
- honestgraft.com/2021/08/as-new-census-numbers-show-biggest.html
- Until 1996, the difference in presidential voting between residents of the nation’s largest 20 metropolitan areas and inhabitants of rural (non-metropolitan) counties resembled the difference between the South (defined here as the eleven states of the former Confederacy plus West Virginia, Kentucky, and Oklahoma) and the North (defined as all other states from the Atlantic coast west to Minnesota, Iowa, and Missouri). Between 2000 and 2008, the urbanism gap was somewhat, though not dramatically, larger than the regional gap. By 2016 and 2020, however, the partisan difference between large metros and rural areas had become fully three times as large as the North-South difference, which had visibly narrowed (from 12 to 9 percentage points) from its 2008 peak.
- As American as Apple Pie? The Rural Vote’s Disproportionate Slice of Power, 2016 nyt
- Rural voters were able to nudge Donald J. Trump to power despite Hillary Clinton’s large margins in cities like New York. In a House of Representatives that structurally disadvantages Democrats because of their tight urban clustering, rural voters helped Republicans hold their cushion. In the Senate, the least populous states are now more overrepresented than ever before. And the growing unity of rural Americans as a voting bloc has converted the rural bias in national politics into a potent Republican advantage.
The Senate of the 116th Congress
28 Republican Senators of the 116th Congress Elected by Fewer Votes than Kamala Harris Alone

Bar Chart of Weight of a Vote for a Representative
Percentage of Votes versus Percentage of Seats in House Elections from 2000 to 2022
- This spreadsheet shows the percentage of votes and seats won by Democrats and Republicans in House elections from 2000 to 2020, based on data from Wikipedia.
- The percentage of votes is the percentage of the total votes for just Democrats and Republicans.
- The rightmost column, PCT Δ, is the difference between a party’s percentage of seats and its percentage of votes. For the 2000 House election, for example:
- PCT Δ = 49.78 – 48.96 = 51.04 – 50.22 = 0.82.
- The last row displays the average PCT Δ.
- The next to last row displays the correlation coefficient between the percentages of votes and seats, 1 indicating a perfect correlation and 0 no correlation.
- The Undemocratic Elections are election where one party won a majority of seats but a minority of votes.

Percentage of Votes versus Percentage of Seats in Senate Elections from 2000 to 2022
- Each Senate election is only for a third of the 100 Senate seats.
Percentage of Votes versus Percentage of Electors in Presidential Elections from 2000 to 2020
- In addition to the two Undemocratic Elections (Bush-Gore and Trump-Clinton), there is also the huge difference between the percentage of votes and percentage of seats in 2008.

Computer Simulations
- In the House, Senate, and Electoral College a party’s proportion of seats (or electors) is determined in part by the proportion of votes it receives and in part by how its votes are distributed across districts or states. The following computer simulations depict how chance, by distributing votes, affects a party’s proportion of seats.
- The simulations, for the House, Senate, and Electoral College, take actual total votes for districts and states and then randomly distribute them between Democrats and Republicans. The House simulation, for example, uses district vote totals from the 2020 House election. Take Mississippi. The actual results of the 2020 election are:
- The simulation reads the district totals into a dataset:
- Then it randomly distributes the totals between Democrats and Republicans using an algorithm that mimics historical distributions, ignoring party. For example:
- Finally it calculates the percentages of votes and seats for each party.


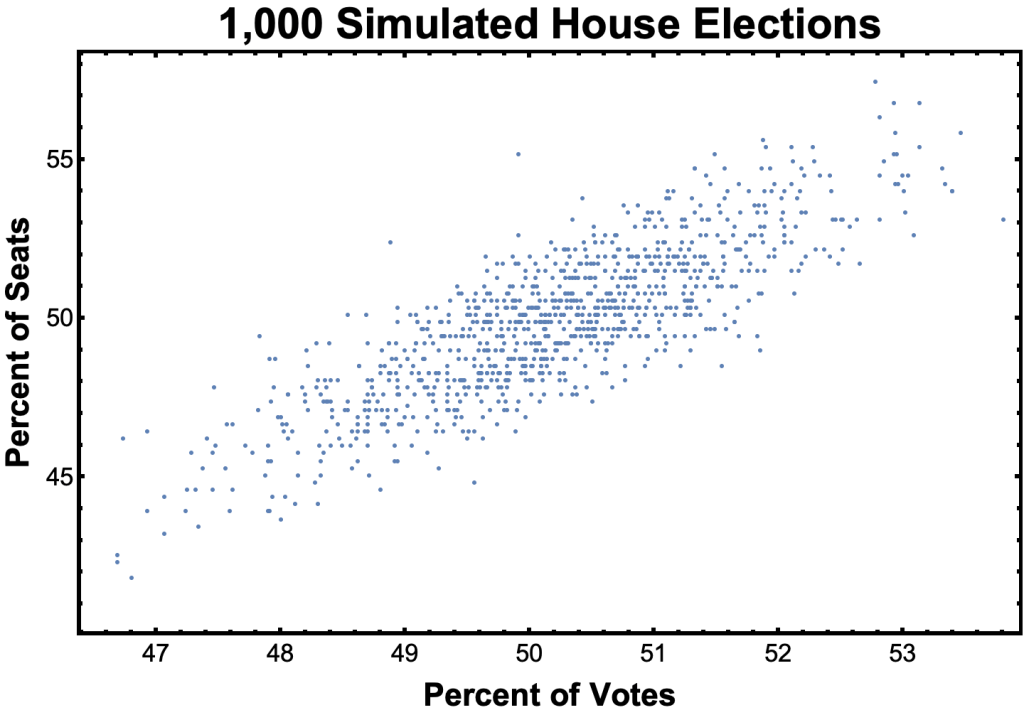
Simulated House Elections
- In this simulation, the total votes cast in each of the 435 congressional districts in the 2020 House election were randomly distributed between Democrats and Republicans.
- Below are the first 25 of 10,00 simulated House elections.
- In the six elections marked Undemocratic Elections one party won the majority of votes, the other the majority of seats.
- 18.61 percent of the 10,000 elections were Undemocratic.
- The correlation coefficient between percentages of votes and seats was 0.8335.
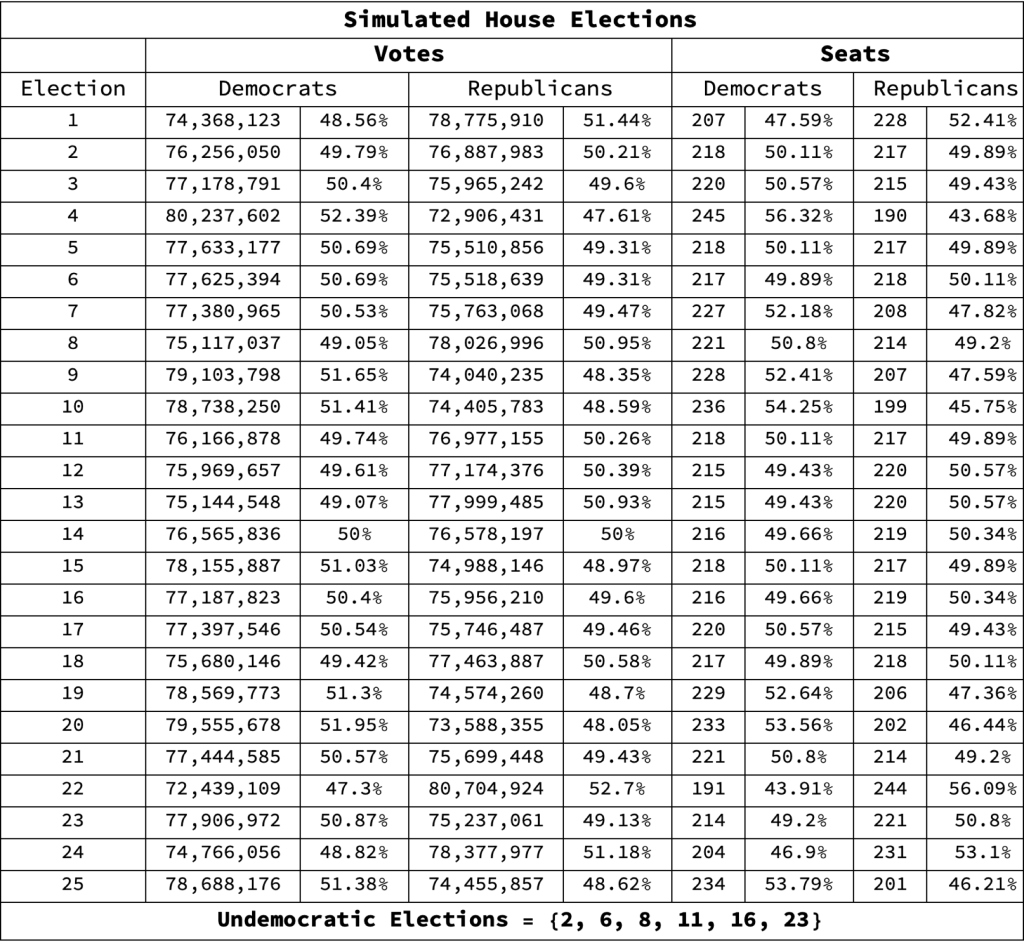
- A scatter plot of percent of seats against percent of votes.
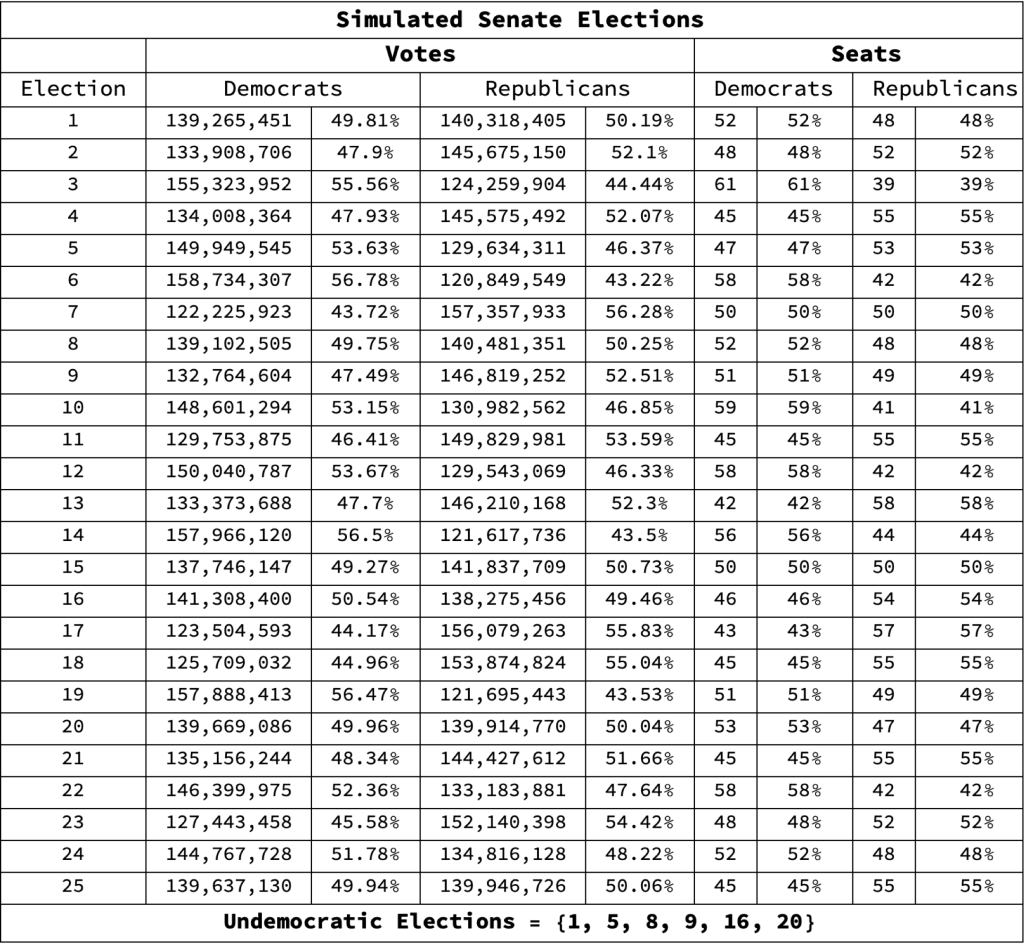
Simulated Senate Elections
- Senate elections are held every two years, each for a third of the seats. In this simulation, however, the simulated election was held for all 100 seats at once.
- The total votes cast in each state are from the 2016, 2018, and 2020 elections
- A surprisingly high 25 percent of the 10,000 elections were Undemocratic and the correlation between percentages of votes and seats was surprisingly low: 0.61375.
Simulated Presidential Elections
- In presidential elections, except for Maine and Nebraska, the winner of a state’s popular vote gets all its electoral votes. To simplify the calculations, all 50 states in the simulated election are winner-take-all.
- The total votes cast in each state are from the 2020 presidential election.
- 18.07 percent of the 10,000 elections were Undemocratic and the correlation coefficient was 0.846.

Detailed Table of Contents
- Three Democratic Norms
- The Flaw of District Representation
- Effect on the House, Senate, and Electoral College
- The House
- The Senate
- Electoral College
- Addendum
- House Basics
- Senate Basics
- Electoral College Basics
- Senate Skews towards Rural Voters, per Nate Silver
- A group of 39 million Americans is represented by two Senators. A group of 38 million Americans is represented by 42
- Articles on Partisan Rural-Urban Divide
- The Senate of the 116th Congress
- 28 Republican Senators of the 116th Congress Elected by Fewer Votes than Kamala Harris Alone
- Bar Chart of Weight of a Vote for a Representative
- Percentage of Votes versus Percentage of Seats in House Elections from 2000 to 2022
- Percentage of Votes versus Percentage of Seats in Senate Elections from 2000 to 2022
- Percentage of Votes versus Percentage of Electors in Presidential Elections from 2000 to 2020
- Computer Simulations
- Detailed Table of Contents
