Contents
- Forecasting
- Forecasting Methods
- Types of Numerical Predictions
- Times Series Forecast, Example
- Regression, Example
- Forecasting Model, Examples
Forecasting
- Forecast means ‘to calculate or predict (some future event or condition) usually as a result of study and analysis of available pertinent data’

Forecasting Methods
Expert Opinion
- Prediction is based on the opinion of a panel of experts, such as IGM Economic Experts Panel
Prediction Markets
- Prediction is based on the opinions of participants investing in a prediction market, such as the Iowa Electronic Markets
Time Series Forecast
- A time series forecast is based on a single time series, a sequence of values of a variable over time.
Regression
- Regression is a statistical method for finding an equation (or line) that best fits the trend of the data and can be used to generate predictions.
Forecasting Model
- A forecasting model is a computer program that generates predictions based on evidential links among variables.
- Models predict climate, weather, the economy, effects of proposed legislation, epidemics, elections, hurricanes, military strategies, investments, sports.
Types of Numerical Predictions
Point
- Single value, typically with a margin of error
- Biden wins 329 electoral votes
Range
- Range of values, typically with a confidence level
- Biden wins between 320 and 340 electoral votes
Probability
- Probability of a single value
- The probability Biden wins is 75 percent.
- Probability of a range
- The probability Biden gets at least 270 electoral votes is 60 percent.
- Probability Distribution (538)
- The probability Biden wins is a probability distribution that looks like:

Times Series Forecast, Example
- A time series forecast is based on a single time series, a sequence of values of a variable over time.
FRED Graph of Real Disposable Personal Income
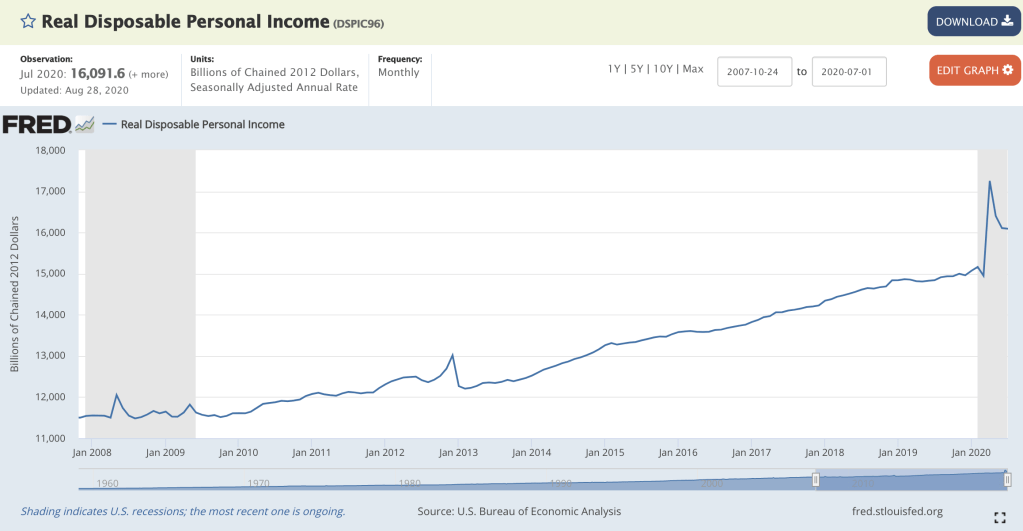
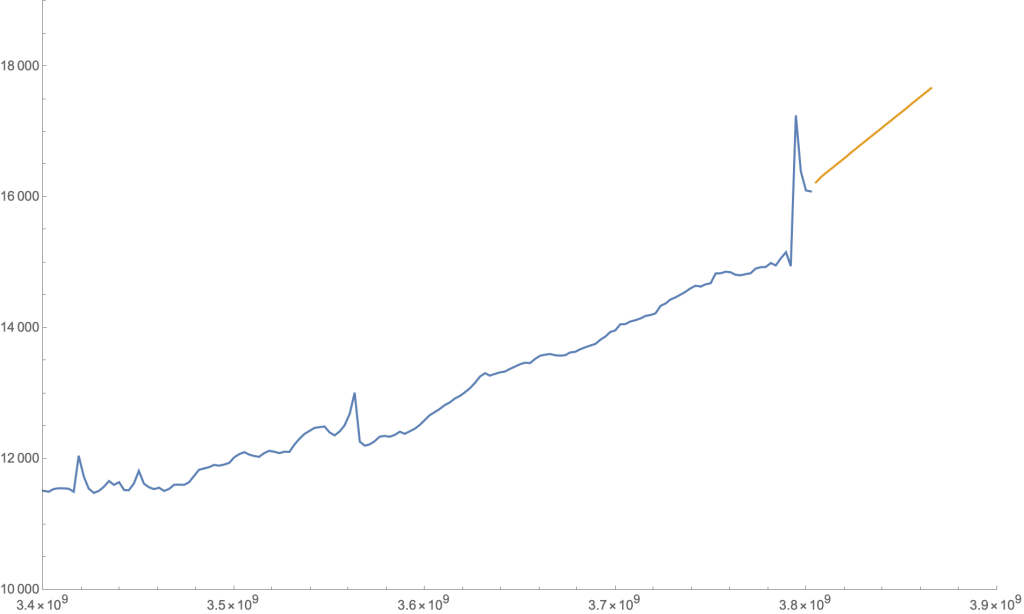
Time Series Forecast of Real Disposable Personal Income
- Mathematica
- fred = ServiceConnect[“FederalReserveEconomicData”]
- tsm = TimeSeriesModelFit[fred[“SeriesData”, “ID” -> {“DSPIC96”}]]
- ARIMAProcess [-0.0262876, {0.168011, -0.0264697, -0.0142413}, 2, {-1.54527, 0.562182}, 10186.4]
- ListLinePlot[{tsm[“TemporalData”], TimeSeriesForecast[tsm, {24}]}, PlotRange -> {{3.4*10^9, 3.9*10^9}, {10000, 19000}}]
Regression, Example
- Regression is a statistical method for finding an equation (or line) that best fits the trend of the data and can be used to generate predictions.
- The predictions predict a dependent variable from independent variables.
Price of a Used Car
- The objective is to predict the Price of a used car based on Age.
- Price is the predicted variable
- Age is the predictor variable
- The Mathematica command LinearModelFit calculates the regression:
- lm = LinearModelFit[data, x , x]
- The result is the formula:
- Price = 7836.26 – (502.425 x Age)
- The formula predicts, for example:
- Price of car Age 4 = 5826.56
- Price of car Age 6 = 4821.71
- Price of car Age 10 = 2812.01

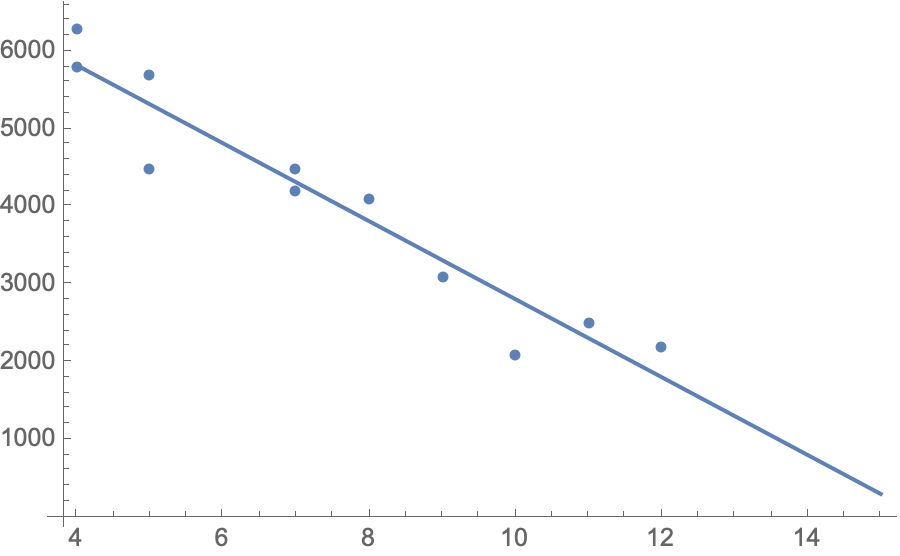
Graph of Price against Age
Dots represent Data Points
The Line represents: Price = 7836.26 – (502.425 x Age)
Forecasting Model, Examples
- Monty Hall Simulation
- Nest Egg Forecast
- Joint Committee on Taxation
- Congressional Budget Office
- Covid-19
- Election Forecasting Sites
- FiveThirtyEight 2020 Election Forecasting Model
A forecasting model is a computer program that generates predictions based on evidential links among variables.
Monty Hall Simulation
To solve the famous probability problem, the Monty Hall Simulation plays the Monty Hall game a million times.
Nest Egg Forecast
The Nest Egg Forecast estimates how long your retirement funds will last.
View Nest Egg Forecast
Joint Committee on Taxation
- The Joint Committee on Taxation (JCT) is a nonpartisan, congressional agency responsible for providing the U.S. Congress with the budgetary effects of all tax legislation.
- From JCT’s Overview Of Revenue Estimating Procedures And Methodologies
- “The largest model used by the Joint Committee staff is the individual model, a model based on a stratified sample of individual tax returns submitted to the IRS. A tax model simulation works by applying the tax laws and parameters to each return on the sample to recreate that return’s Federal individual income tax liability for a given year. The model generally assumes that taxpayers make optimal choices regarding such decisions as claiming itemized deductions or claiming credits. Then, by changing rules or parameters reflected by a tax proposal, each return’s liability is recalculated. This produces an estimated change in liability for that proposal.”
Congressional Budget Office
- The Congressional Budget Office (CBO) is a “strictly nonpartisan” federal agency of the legislative branch that conducts objective, impartial “analyses of budgetary and economic issues to support the Congressional budget process
- Seven Things to Know About CBO’s Analyses
- The analyses involve regular use of hundreds of models and other estimating techniques. For example, the agency estimated the effects of the ACA on the labor supply in its economic projections mainly by calculating the effects of the law on marginal and average tax rates and drawing upon research about changes in the labor supply resulting from changes in tax rates.
Covid-19
- Model developed by the Institute for Health Metrics and Evaluation at University of Washington’s School of Medicine
Election Forecasting Sites
- Sabato’s Crystal Ball
- Nathan L Gonzales Inside Elections
- Cook Political Report
- Iowa Electronic Markets
- Dormant
- FiveThirtyEight
- Princeton Election Consortium
- Polly Vote
- 270 to Win
FiveThirtyEight 2020 Election Forecasting Model
Overview
- The FiveThirtyEight model runs 40,000 simulations, tallying how many electoral votes the candidates get in each run. Probabilities are determined by counting simulations. For example, if Biden gets at least 270 electoral votes in 26,000 simulations, his probability of winning is 26,000/40,000 = 65 percent.
- The model weighs:
- state polls
- how a state voted in the last two presidential elections
- whether the state is home to the presidential or vice presidential candidate
- how easy it is to vote in the state
- economic conditions (jobs, personal income, personal spending, manufacturing, inflation, stock market)
- uncertainty, including how much polling error is correlated across states regarding:
- Race, Religion, Latitude and longitude, Region (North, South, Midwest, West), Urbanization, Median household income, Median age, Gender, Education, Immigration, COVID-19 severity index, expected vote by mail .
Procedure
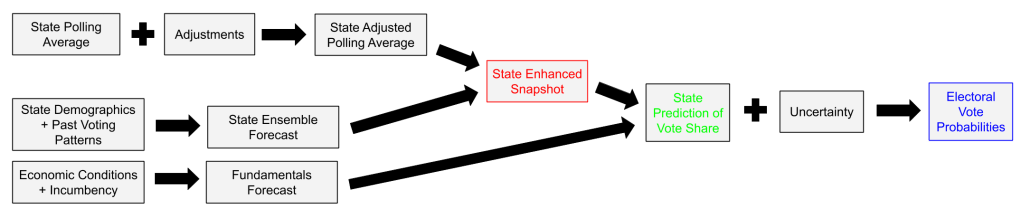
- FiveThirtyEight combines polling averages, demographics, and past voting patterns to generate an Enhanced Snapshot of each state.
- The Enhanced Snapshots are combined with economic predictions and incumbency advantage to make Predictions of Vote Share for each state.
- The state Predictions of Vote Share, factored by uncertainties, are used to compute, for each n from 0 to 538, how probable each candidate is to win n electoral votes. The computation comprises 40,000 simulations.
- The Electoral Vote Probabilities are used to predict the probabilities that each candidate will get at least 270 electoral votes.
- The Electoral Vote Probabilities are also used to calculate the expected electoral votes for each candidate
- Expected electoral votes = the sum, for each n from 0 to 538, of the probability of the candidate winning n electoral votes times n.
Flowchart for FiveThirtyEight 2020 Election Forecast
Details
- Adjustments
- Likely voter adjustment
- House effects adjustment
- Timeline adjustment
- Demographics + Past Voting Patterns
- How the state voted in the past two presidential elections compared with the national average.
- Whether the state is home to the presidential or vice presidential candidate
- How easy it is to vote in the state, based on the Cost of Voting Index
- States with higher barriers to voting tend to produce better results for Republican candidates and states with lower barriers tend to lean more Democratic.
- Economic Conditions
- Jobs, as indicated by nonfarm payrolls
- Spending, as indicated by real personal consumption expenditures.
- Income, as measured by real disposable personal income.
- Manufacturing, as measured by industrial production.
- Inflation, based on the consumer price index.
- Stock market, based on the S&P 500.
- Uncertainty
- National drift
- How much the overall national forecast could change before Election Day
- Election Day error
- How much the final forecast of the national popular vote could be off on Election Day
- Correlated state error
- How much polling error is correlated across states regarding:
- Race, Religion, Latitude and longitude, Region (North, South, Midwest, West), Urbanization, Median household income, Median age, Gender, Education, Immigration, COVID-19 severity index, expected vote by mail
- How much polling error is correlated across states regarding:
- State-specific error
- How much the state prediction could be off on Election Day
- National drift
Prediction of Texas Vote Share

But Nate, you were wrong in 2016.
- How FiveThirtyEight’s 2020 Presidential Forecast Works — And What’s Different Because Of COVID-19, Nate Silver (538, August 12, 2020)
- We’d like to address one thing upfront, though: We think our model did a good job in 2016. Although it had Hillary Clinton favored, it gave Donald Trump around a 30 percent chance of winning on Election Day,1 which was considerably higher than other models, prediction markets and the conventional wisdom about the race. Moreover, the reasons the model was more bullish on Trump than other forecasts — such as detecting a potential overperformance for Trump in the Electoral College — proved to be important to the outcome.
- Also, we’ve found that FiveThirtyEight’s models — including our election forecasts since they were first published in 2008 — have been well calibrated over time. Candidates who our models claim have a 30 percent chance of winning really do win their races about 30 percent of the time, for example.
