Contents
- FRED Federal Reserve Economic Data
- What’s FRED?
- Real GDP Annual Percent Change
- Features of Graphs
- Links to Commonly Used Graphs
- Examples of Customized Graphs
FRED
Federal Reserve Economic Data
What’s FRED?
FRED, short for Federal Reserve Economic Data, is an online database consisting of hundred of thousands of economic data time series from scores of national, international, public, and private sources. FRED, created and maintained by the Research Department at the Federal Reserve Bank of St. Louis, goes far beyond simply providing data: It combines data with a powerful mix of tools that help the user understand, interact with, display, and disseminate the data. In essence, FRED helps users tell their data stories. The purpose of this article is to guide the potential (or current) FRED user through the various aspects and tools of the database.”
Real GDP Annual Percent Change
fred.stlouisfed.org/series/A191RL1Q225SBEA

Features of Graphs
- Time-range Sliders
- Mouse-over data points
- Gray areas for recessions
- Search bar
- Browse
- Edit Graph
- Edit Lines
- Units
- Frequency
- Format
- Graph Type
- Line
- Bar
- Pie
- Graph Type
- Edit Lines
Links to Commonly Used Graphs
- Civilian Employment Level
- Civilian Unemployment Rate
- Corporate Profits
- Federal Debt: Total Public Debt
- Federal Debt as Percent of GDP
- Federal Debt: Interest as percent of GDP
- Federal Deficits
- Federal Deficits as percent of GDP
- Federal Receipts
- Federal Surplus or Deficit
- Industrial Production: Consumer Goods
- Industrial Production Index
- Inflation:
- Jobs
- Manufacturing Output
- Personal Income
- Personal Spending
- Real Net Exports of Goods and Services
- Real Gross Domestic Product
- Real Gross Domestic Product Percent Changed
- Real Gross Domestic Product per Capita
- Real Potential GDP Projected by CBO
- Regular Gas Price
- Retail Sales: Retail Trade, Advance
- Retail Sales: Retail Trade and Food Services, Advance
- Retail Sales: Retail Trade and Food Services
- Trade Balance
- Unemployment Insurance Claims
- Wages
Examples of Customized Graphs
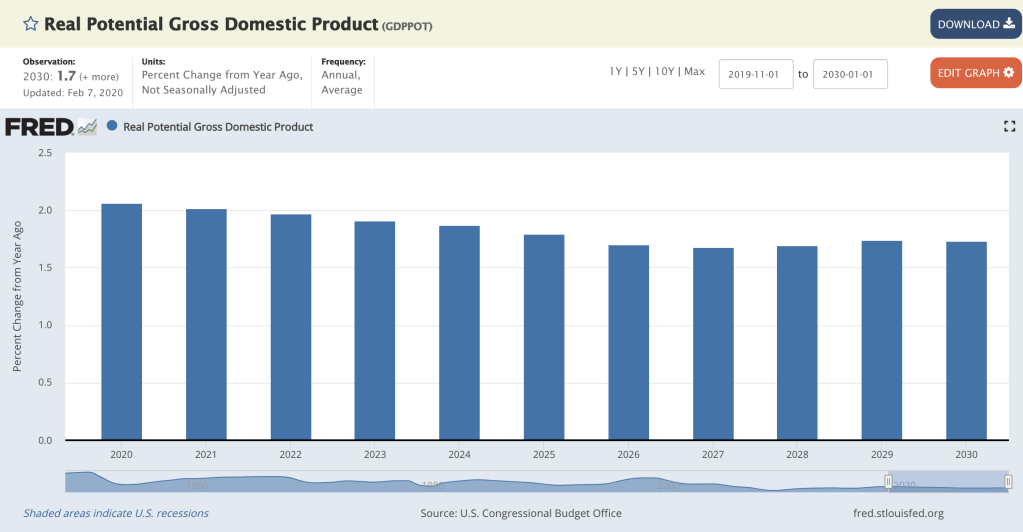
Real Potential GDP Projected by CBO (Customized)
fred.stlouisfed.org/series/GDPPOT
Federal Surplus or Deficit (Customized)
fred.stlouisfed.org/series/FYFSD

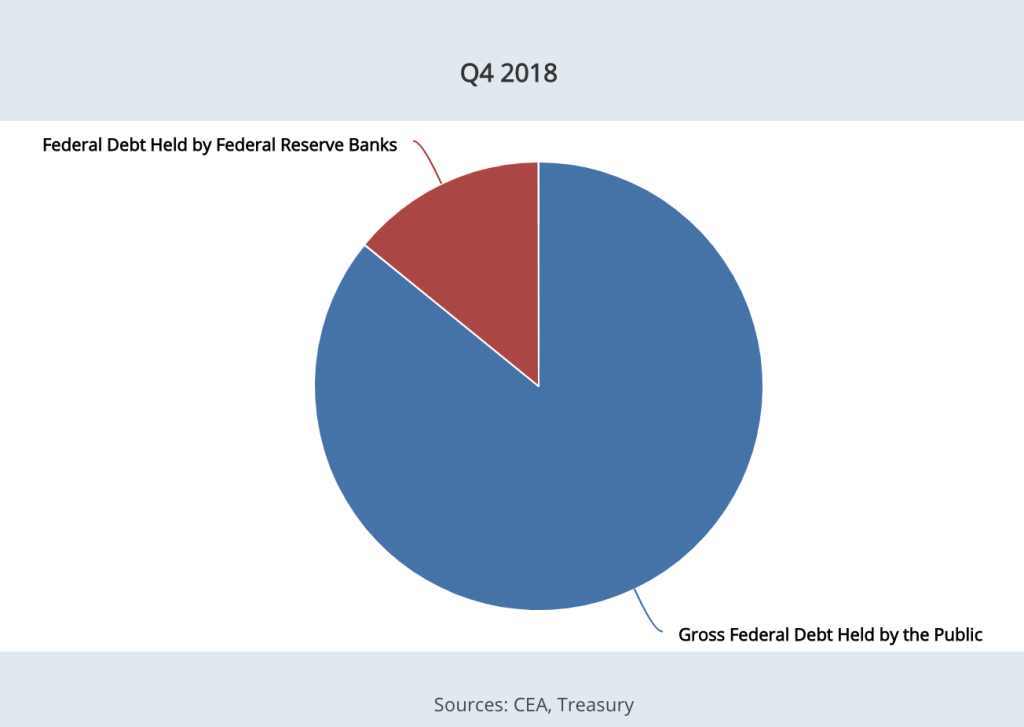
Pie Chart of Debt (Customized)
fred.stlouisfed.org/series/FYGFDPUB
Unemployment Rate (Time Period Customized)
fred.stlouisfed.org/series/UNRATE

Jobs Added Monthly (Customized)
fred.stlouisfed.org/series/PAYEMS

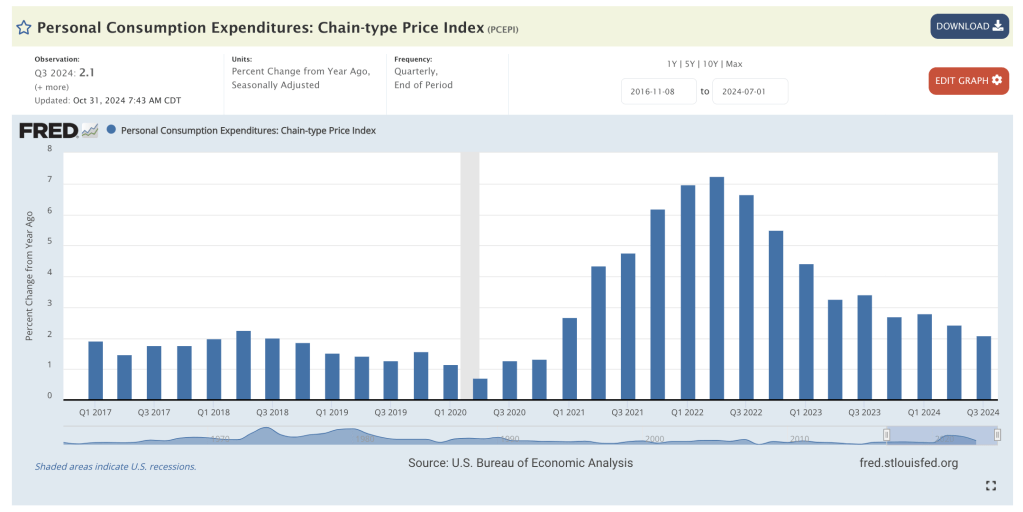
Personal Consumption Expenditures (Customized)
- fred.stlouisfed.org/series/PCEPI#
- Bar, Quarterly, Percent Change from Year Ago, End of Period, Seasonally Adjusted