Contents
- Premise 1
- Premise 2
- Argument for Premise 2
- Premise 2A: Atmospheric greenhouse gases have increased since the Industrial Revolution.
- Premise 2B: The increase in atmospheric greenhouse gases since the Industrial Revolution explains the increase in Earth’s surface temperature.
- Premise 2C: There’s no other plausible explanation of the increase in Earth’s surface temperature.
- Argument for Premise 2
- Premise 3
- Miscellany
- 6th Intergovernmental Panel on Climate Change 2021
- AR6 Synthesis Report Climate Change 2023
Premise 1
Earth’s average surface temperature has increased rapidly since the mid-20th century.

Image Credit data.giss.nasa.gov/gistemp/graphs_v4/
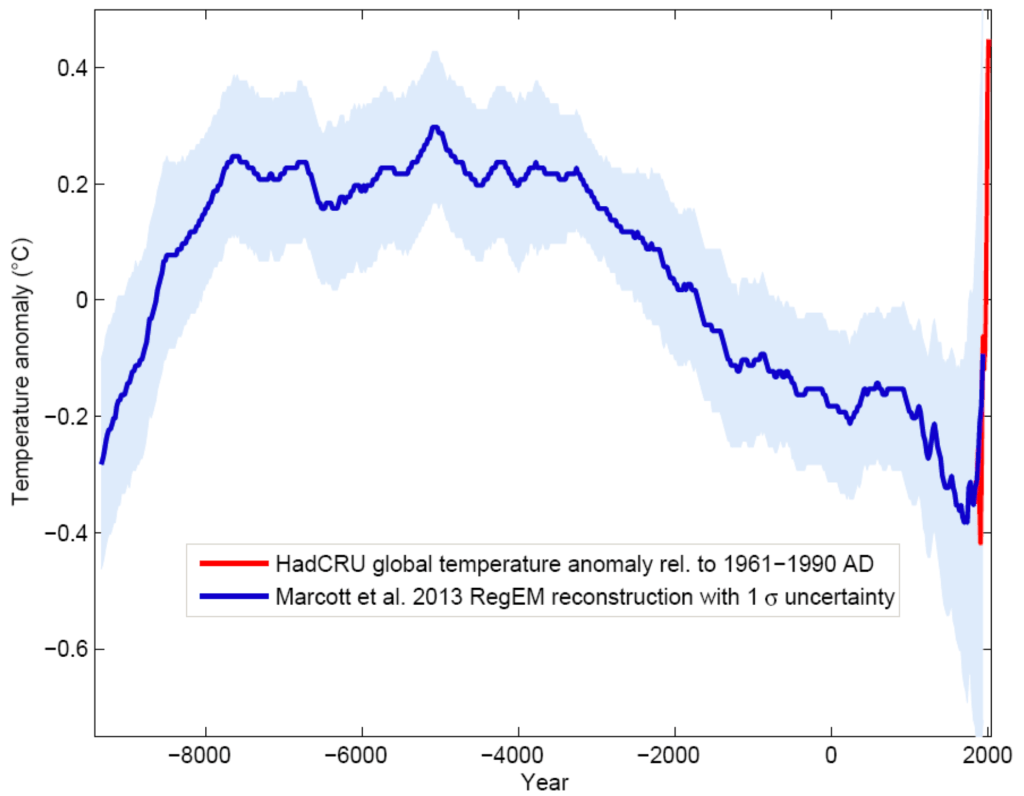
Image Credit realclimate.org/index.php/archives/2013/09/paleoclimate-the-end-of-the-holocene/

Image Credit ncdc.noaa.gov/sotc/global/202013

Image Credit ncdc.noaa.gov/sotc/global/202013#gtemp
The decadal global land and ocean surface average temperature anomaly for 2011–2020 was the warmest decade on record for the globe, with a surface global temperature of +0.82°C (+1.48°F) above the 20th century average. This surpassed the previous decadal record (2001–2010) value of +0.62°C (+1.12°F).
Premise 2
The only plausible explanation of the increase in Earth’s average surface temperature is the increase of atmospheric greenhouse gases since the Industrial Revolution, especially carbon dioxide and methane.
Argument for Premise 2
- Premise 2A: Atmospheric greenhouse gases have increased since the Industrial Revolution, especially carbon dioxide and methane.
- Premise 2B: The increase in atmospheric greenhouse gases since the Industrial Revolution explains the increase in Earth’s surface temperature
- Premise 2C: There’s no other plausible explanation of the increase in Earth’s surface temperature.
Volcanic ActivityVariations in Solar OutputVariations in Earth’s orbit (Milankovitch Cycles)
- Conclusion: The only plausible explanation of the increase in Earth’s surface temperature is the increase in atmospheric greenhouse gases since the Industrial Revolution, especially carbon dioxide and methane.
Premise 2A: Atmospheric greenhouse gases have increased since the Industrial Revolution.
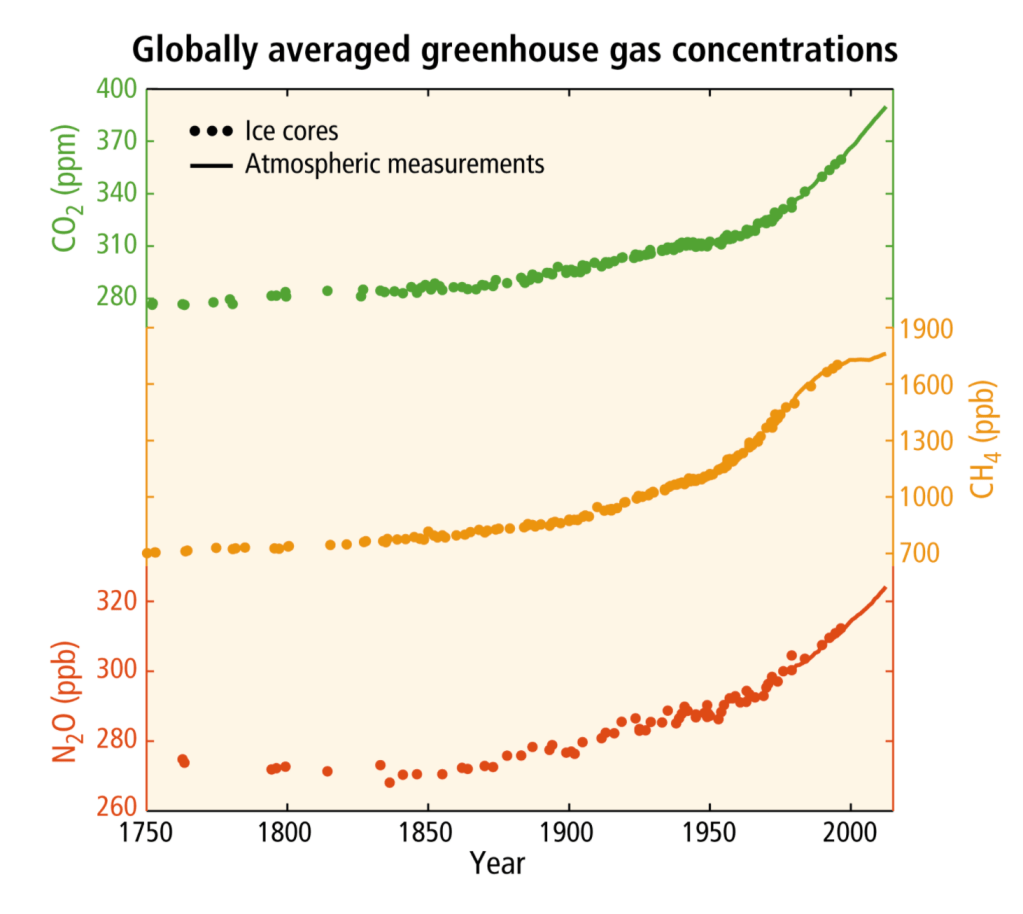
Image Credit: ar5-syr.ipcc.ch/topic_observedchanges.php
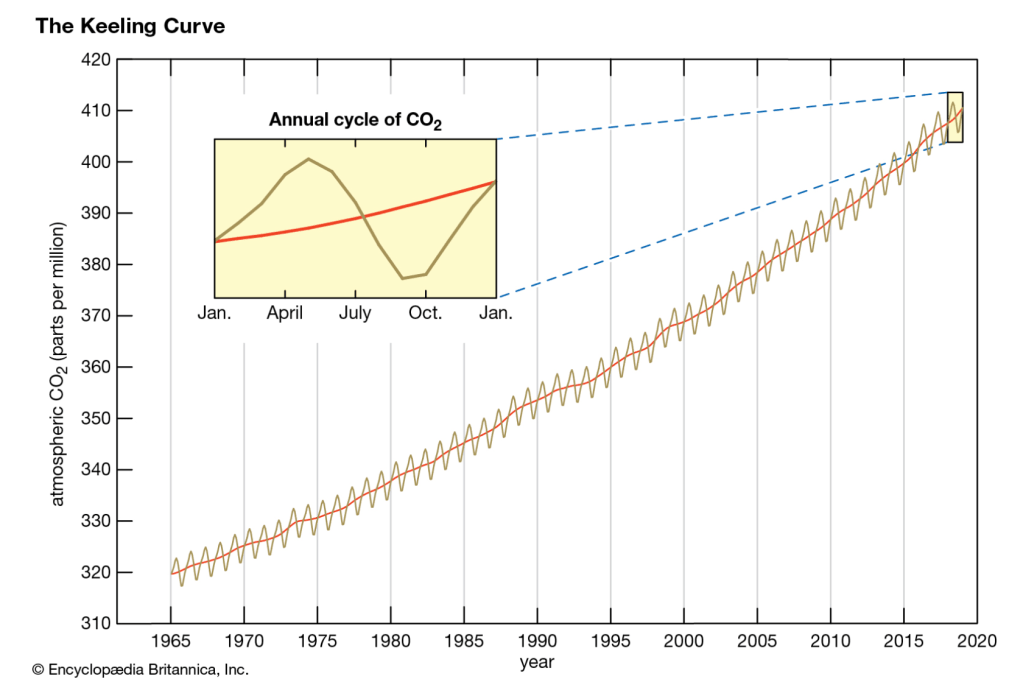
Image Credit: britannica.com/science/Keeling-Curve
Methane
- britannica.com/science/global-warming/methane
- Preindustrial levels of CH4 in the atmosphere were approximately 700 ppb (parts per billion).
- esrl.noaa.gov/gmd/ccgg/trends_ch4/
- Atmospheric methane reached 1876.9 ppb in August 2020
Premise 2B: The increase in atmospheric greenhouse gases since the Industrial Revolution explains the increase in Earth’s surface temperature.
Per the Natural Greenhouse Effect
Premise 2C: There’s no other plausible explanation of the increase in Earth’s surface temperature.
Volcanic Activity- Volcanoes are a natural source of atmospheric carbon dioxide. However, the amount of volcanic CO2 is too small to account for global warming.
- scientificamerican.com/article/earthtalks-volcanoes-or-humans/
- According to the U.S. Geological Survey (USGS), the world’s volcanoes, both on land and undersea, generate about 200 million tons of carbon dioxide (CO2) annually, while our automotive and industrial activities cause some 24 billion tons of CO2 emissions every year worldwide. Despite the arguments to the contrary, the facts speak for themselves: Greenhouse gas emissions from volcanoes comprise less than one percent of those generated by today’s human endeavors.
- scientificamerican.com/article/earthtalks-volcanoes-or-humans/
- In addition to carbon dioxide, volcanoes emit aerosols (little particles of stuff). Unlike greenhouse gases, most aerosols have a cooling effect on Earth’s surface. For example, per NASA:
- Two volcanic eruptions, El Chichon in 1982 and Pinatubo in 1991, pumped sulfur dioxide gas into the atmosphere, which was converted into tiny particles that lingered for over a year, reflecting sunlight and shading Earth’s surface. Temperatures across the globe dipped for two to three years.
- Volcanoes are a natural source of atmospheric carbon dioxide. However, the amount of volcanic CO2 is too small to account for global warming.
Variations in Solar Output- Is the Sun causing global warming? (NASA at climate.nasa.gov/faq/14/is-the-sun-causing-global-warming/)
- The amount of solar energy received by the Earth has followed the Sun’s natural 11-year cycle of small ups and downs with no net increase since the 1950s. Over the same period, global temperature has risen markedly. It is therefore extremely unlikely that the Sun has caused the observed global temperature warming trend over the past half-century.
- Moreover, if the Sun were responsible for global warming, we would expect to see warming throughout all layers of the atmosphere, from the surface all the way up to the upper atmosphere (stratosphere). But what we see is warming at the surface and cooling in the stratosphere. This is consistent with the warming being caused by a build-up of heat-trapping gases near the surface of the Earth, and not by the Sun getting “hotter.”
- Is the Sun causing global warming? (NASA at climate.nasa.gov/faq/14/is-the-sun-causing-global-warming/)
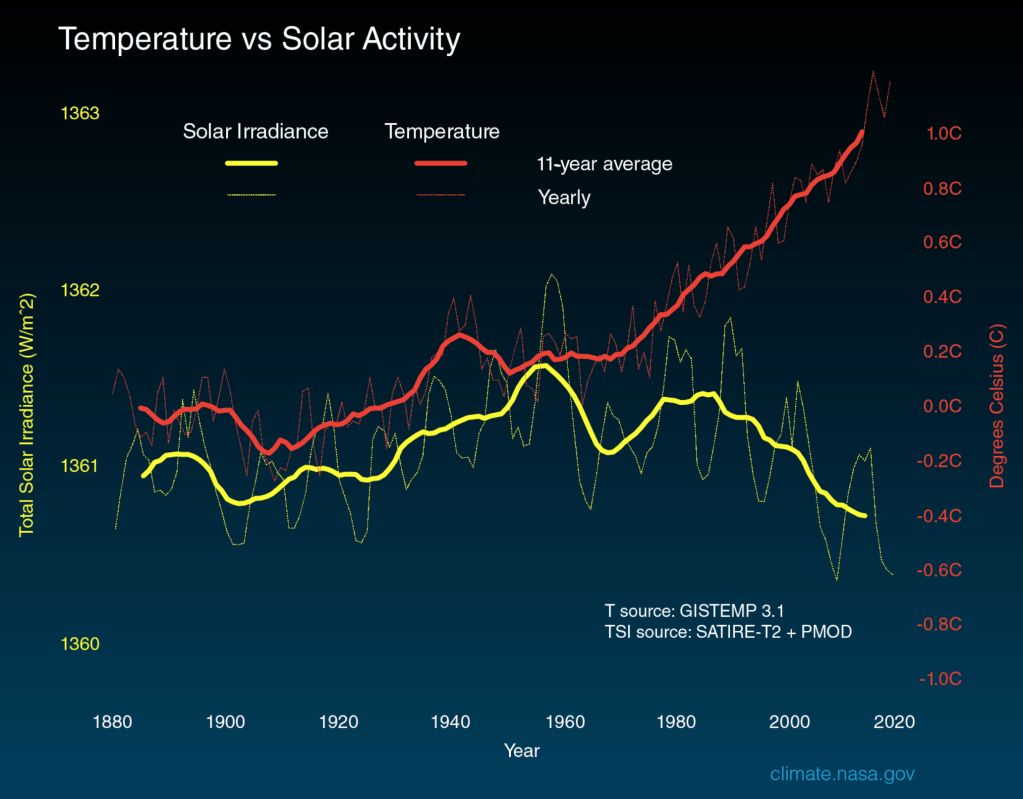
Image Credit: climate.nasa.gov/faq/14/is-the-sun-causing-global-warming/
Variations in Earth’s orbit (Milankovitch Cycles)- The Milankovitch Cycles are periodic changes in
- the shape of Earth’s orbit (100,000 and 413,000 year cycles)
- the tilt of Earth’s axis of rotation (41,000 year cycle)
- the precession of the equinoxes (26,000 year cycle).
- Why Milankovitch (Orbital) Cycles Can’t Explain Earth’s Current Warming (NASA at climate.nasa.gov/blog/2949/why-milankovitch-orbital-cycles-cant-explain-earths-current-warming/)
- The Milankovitch Cycles cannot account for the current period of rapid warming Earth has experienced since the pre-Industrial period (the period between 1850 and 1900), and particularly since the mid-20th Century.
- Milankovitch cycles operate on long time scales, ranging from tens of thousands to hundreds of thousands of years. In contrast, Earth’s current warming has taken place over time scales of decades to centuries. Over the last 150 years, Milankovitch cycles have not changed the amount of solar energy absorbed by Earth very much.
- Moreover, Earth is currently in an interglacial period (a period of milder climate between Ice Ages). If there were no human influences on climate, scientists say Earth’s current orbital positions within the Milankovitch cycles predict our planet should be cooling, not warming, continuing a long-term cooling trend that began 6,000 years ago.
- britannica.com/science/global-warming/Variations-in-Earths-orbit
- Earth’s orbital changes are generally believed to have had little impact on climate over the past few millennia, and so they are not considered to be significant factors in present-day climate variability.
- Milankovitch (Orbital) Cycles and Their Role in Earth’s Climate (NASA at climate.nasa.gov/news/2948/milankovitch-orbital-cycles-and-their-role-in-earths-climate/)
- The Milankovitch Cycles are periodic changes in

Image Credit: uwpcc.ocean.washington.edu/file/Milankovitch_Cycles

Image Credit: ossfoundation.us/projects/environment/global-warming/milankovitch-cycles/image/image_view_fullscreen
Premise 3
The only plausible explanation of the increase in atmospheric greenhouse gases is the injection of greenhouse gases into the atmosphere by human activity.
Carbon Dioxide
- Climate Change: Atmospheric Carbon Dioxide (NOAA at climate.gov/news-features/understanding-climate/climate-change-atmospheric-carbon-dioxide)
- Before the Industrial Revolution started in the mid-1700s, the global average amount of carbon dioxide was about 280 ppm.
- The global average amount of carbon dioxide hit a new record high in 2019: 409.8 parts per million.

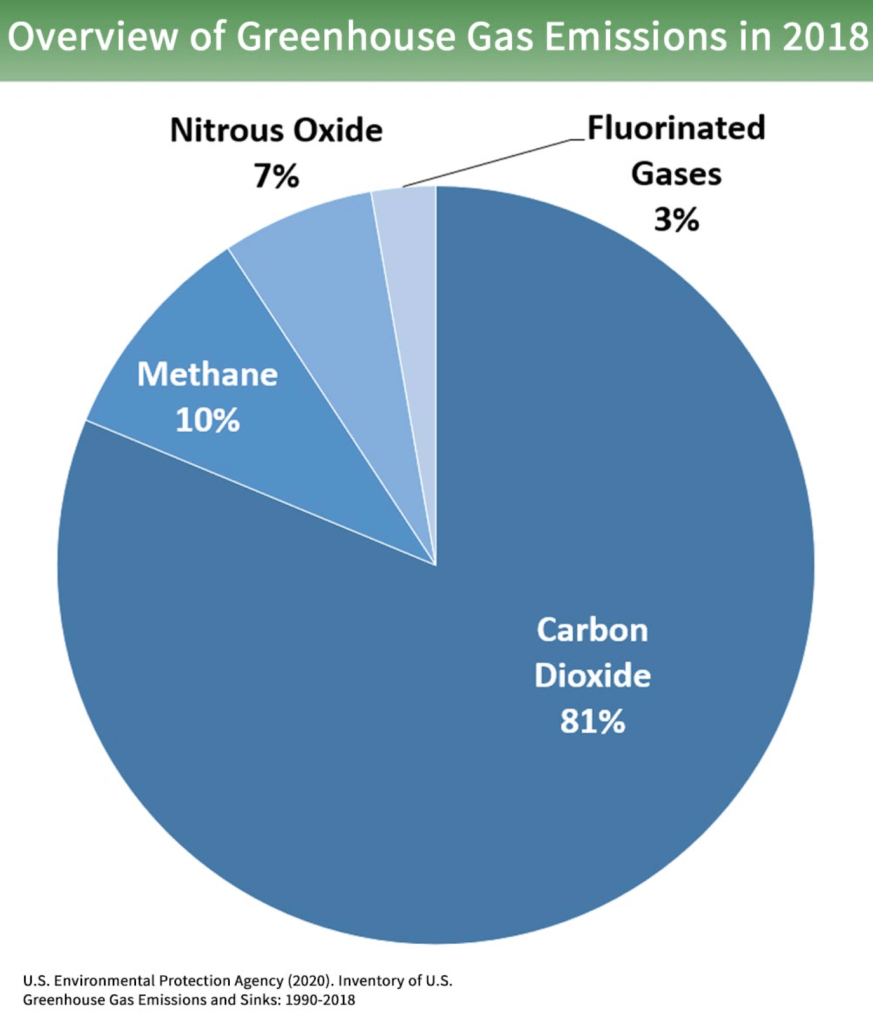
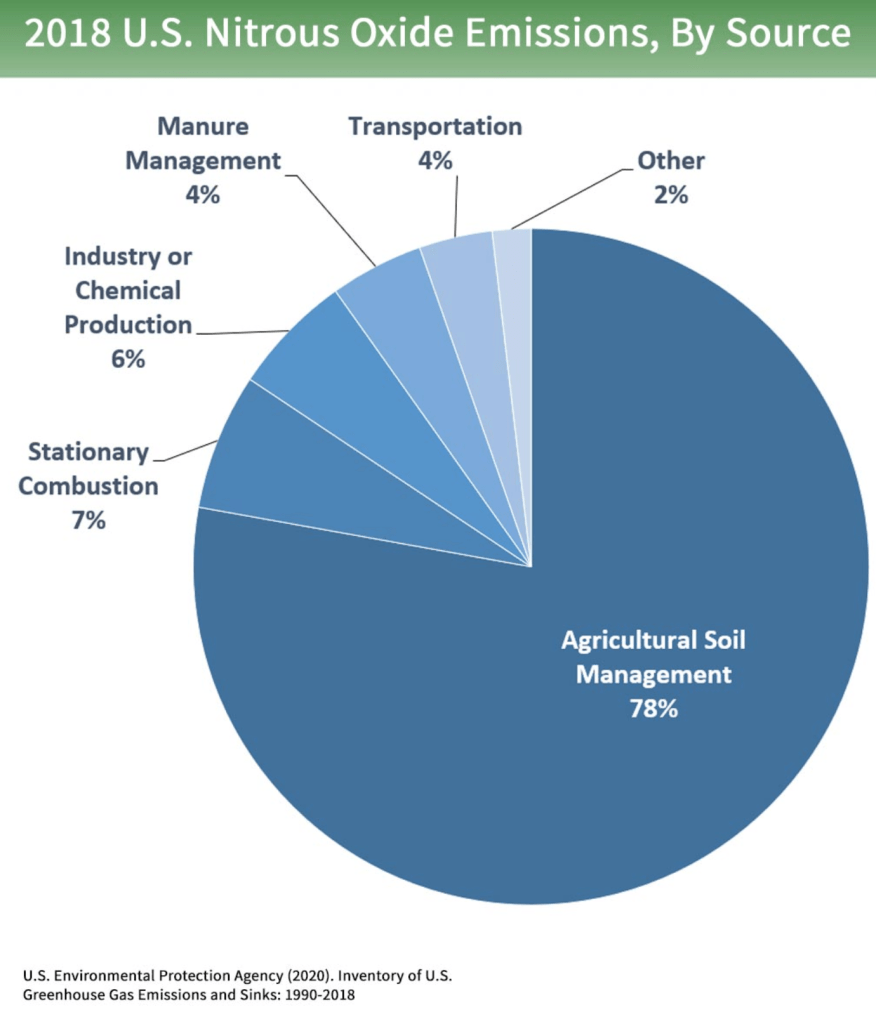
Greenhouse Gas Emissions
epa.gov/ghgemissions/overview-greenhouse-gases


Miscellany
Image Credit: climate.gov/news-features/understanding-climate/climate-change-atmospheric-carbon-dioxide

Image Credit: climate.gov/news-features/understanding-climate/climate-change-atmospheric-carbon-dioxide
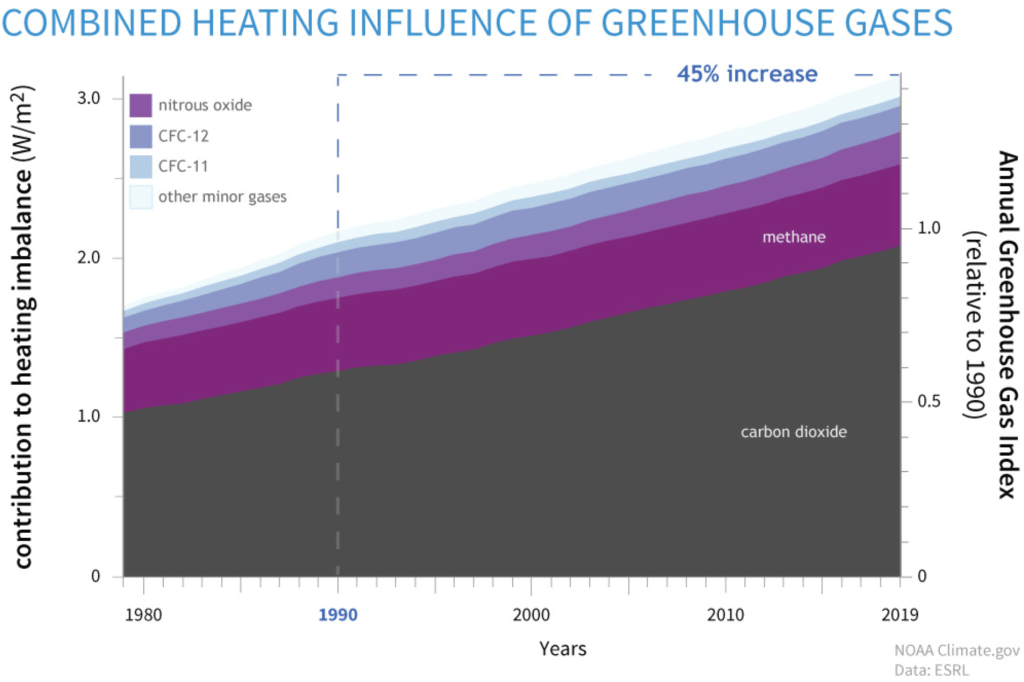
Image Credit: climate.gov/news-features/understanding-climate/climate-change-atmospheric-carbon-dioxide
Methane
- britannica.com/science/global-warming/Carbon-dioxide#ref274826
- Preindustrial levels of CH4 in the atmosphere were approximately 700 ppb (parts per billion).
- esrl.noaa.gov/gmd/ccgg/trends_ch4/
- Atmospheric methane reached 1876.9 ppb in August 2020

Image Credit: esrl.noaa.gov/gmd/ccgg/trends_ch4/
6th Intergovernmental Panel on Climate Change 2021
The Physical Science Basis
Summary for Policymakers
- Home Page
- Headline Statements
- Summary for Policy Makers
- Interactive Atlas
A. The Current State of the Climate
- A.1 It is unequivocal that human influence has warmed the atmosphere, ocean and land. Widespread and rapid changes in the atmosphere, ocean, cryosphere, and biosphere have occurred.
- [The cryosphere is the frozen water part of the Earth system.]
- [Anthropogenic global warming is thus beyond a reasonable doubt.]
- A.1.1 Observed increases in well-mixed greenhouse gas (GHG) concentrations since around 1750 are unequivocally caused by human activities. Since 2011 (measurements reported in AR5), concentrations have continued to increase in the atmosphere, reaching annual averages of
- 410 ppm for carbon dioxide (CO2),
- [Preindustrial level = 280 ppm. ]
- 1866 ppb for methane (CH4),
- [Preindustrial level = 700 ppb.]
- 332 ppb for nitrous oxide (N2O)
- [Preindustrial level = 269 ppb.]
- in 2019 . Land and ocean have taken up a near-constant proportion (globally about 56% per year) of CO2 emissions from human activities over the past six decades, with regional differences (high confidence)
- A.1.2 Each of the last four decades has been successively warmer than any decade that preceded it since 1850. Global surface temperature in the first two decades of the 21st century (2001-2020) was 0.99 [0.84- 1.10] °C higher than 1850-19009 .
- Global surface temperature was 1.09 [0.95 to 1.20] °C higher in 2011– 2020 than 1850–1900, with larger increases over land (1.59 [1.34 to 1.83] °C) than over the ocean (0.88 [0.68 to 1.01] °C).
- A.1.7 Global mean sea level increased by 0.20 [0.15 to 0.25] m between 1901 and 2018.
- [0.2 meters = 7.87 inches]
- 410 ppm for carbon dioxide (CO2),
- A.2 The scale of recent changes across the climate system as a whole and the present state of many aspects of the climate system are unprecedented over many centuries to many thousands of years.
- A.3 Human-induced climate change is already affecting many weather and climate extremes in every region across the globe. Evidence of observed changes in extremes such as heatwaves, heavy precipitation, droughts, and tropical cyclones, and, in particular, their attribution to human influence, has strengthened since the Fifth Assessment Report (AR5).
- [An extreme event attribution study tries to determine how much an extreme weather event can be attributed to global warming and how much to natural weather patterns and random climate variability.]
- Global surface temperature was 1.09 [0.95 to 1.20] °C higher in 2011– 2020 than 1850–1900, with larger increases over land (1.59 [1.34 to 1.83] °C) than over the ocean (0.88 [0.68 to 1.01] °C).
- [x to y] means the interval between x and y is “very likely,” meaning 90% probability
- The period 1850–1900 is the earliest period of enough observations to estimate global surface temperature and is used as an approximation for pre-industrial conditions.
- [Interval of 1.09 °C = interval of 1.962 °F]
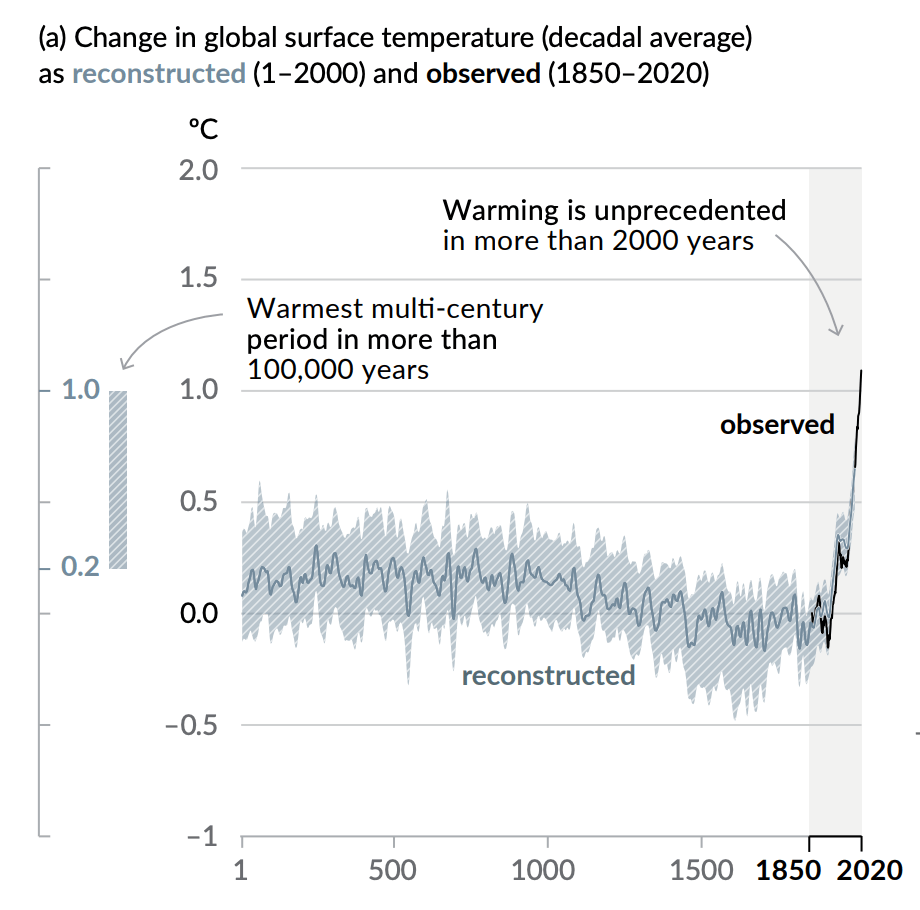
Image Credit ipcc.ch/report/ar6/wg1/downloads/report/IPCC_AR6_WGI_SPM.pdf
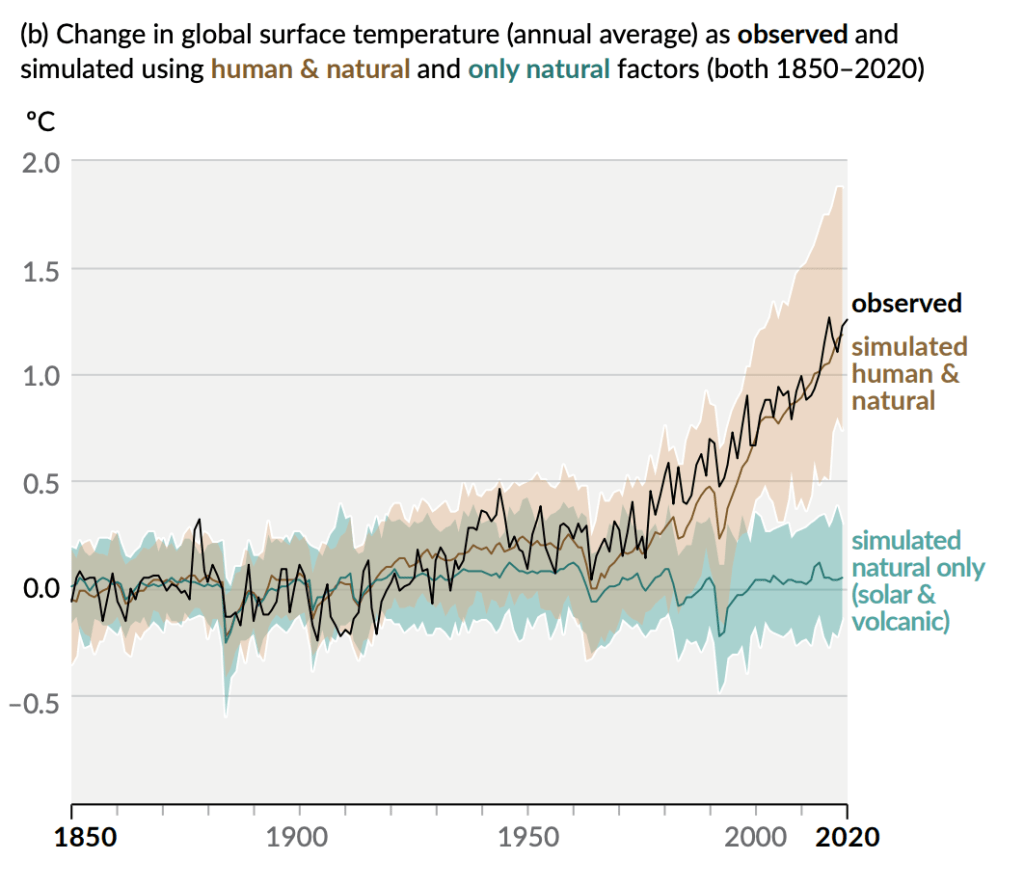
Image Credit ipcc.ch/report/ar6/wg1/downloads/report/IPCC_AR6_WGI_SPM.pdf
- Black line is observed temperatures.
- Brown line is a simulation of temperatures due to both human and natural causes.
- Shaded area is “very likely” forecast.
- Green line is a simulation of temperatures due to natural causes only.
- Shaded area is “very likely” forecast.
B. Possible Climate Futures
- B.1 Global surface temperature will continue to increase until at least the mid-century under all emissions scenarios considered. Global warming of 1.5°C and 2°C will be exceeded during the 21st century unless deep reductions in carbon dioxide (CO2) and other greenhouse gas emissions occur in the coming decades.
- [Current global warming is 1.09 °C.]
- B.2 Many changes in the climate system become larger in direct relation to increasing global warming. They include increases
- in the frequency and intensity of hot extremes, marine heatwaves, and heavy precipitation
- agricultural and ecological droughts in some regions
- proportion of intense tropical cyclones, and
- reductions in Arctic sea ice, snow cover and permafrost.
- B.3 Continued global warming is projected to further intensify the global water cycle, including its variability, global monsoon precipitation and the severity of wet and dry events.
- B.4 Under scenarios with increasing CO2 emissions, the ocean and land carbon sinks are projected to be less effective at slowing the accumulation of CO2 in the atmosphere.
- B.5 Many changes due to past and future greenhouse gas emissions are irreversible for centuries to millennia, especially changes in the ocean, ice sheets and global sea level.
- The report assesses how the climate responds to five scenarios that cover the range of possible future development of anthropogenic drivers of climate change. They start in 2015, and include scenarios with
- high and very high GHG emissions (SSP3-7.0 and SSP5-8.5) and CO2 emissions that roughly double from current levels by 2100 and 2050
- intermediate GHG emissions (SSP2-4.5) and CO2 emissions remaining around current levels until the middle of the century
- scenarios with very low and low GHG emissions and CO2 emissions declining to net zero around or after 2050, followed by varying levels of net negative CO2 emissions (SSP1-1.9 and SSP1-2.6).
- Emissions vary between scenarios depending on
- socio-economic assumptions
- levels of climate change mitigation
- air pollution controls (for aerosols and non methane ozone precursors)
- SSPx-y
- ‘SSPx’ refers to the Shared Socio-economic Pathway or ‘SSP’ describing the socio-economic trends underlying the scenario, and ‘y’ refers to the approximate level of radiative forcing (in watts per meters squared ) resulting from the scenario in the year 2100.
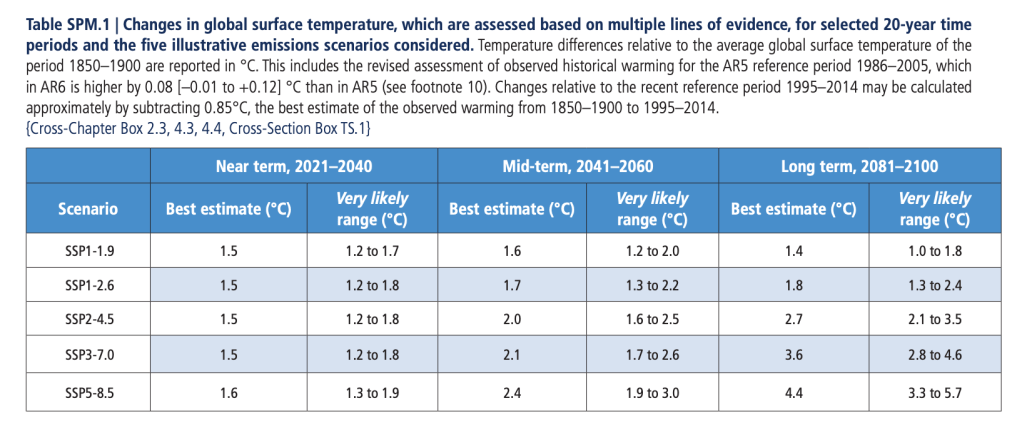
Image Credit ipcc.ch/report/ar6/wg1/downloads/report/IPCC_AR6_WGI_SPM.pdf
- SSP3-7.0
- High GHG emissions with CO2 emissions that roughly double from current levels by 2100 and 2050
- SSP2-4.5
- Intermediate GHG emissions with CO2 emissions remaining around current levels until the middle of the century
- SSP1-2.6
- Low GHG emissions with CO2 emissions declining to net zero around or after 2050, followed by varying levels of net negative CO2 emissions
C. Climate Information for Risk Assessment and Regional Adaptation
D. Limiting Future Climate Change
- D.1 From a physical science perspective, limiting human-induced global warming to a specific level requires limiting cumulative CO2 emissions, reaching at least net zero CO2 emissions, along with strong reductions in other greenhouse gas emissions. Strong, rapid and sustained reductions in CH4 emissions would also limit the warming effect resulting from declining aerosol pollution and would improve air quality.
- D.2 Scenarios with low or very low greenhouse gas (GHG) emissions (SSP1-1.9 and SSP1- 2.6) lead within years to discernible effects on greenhouse gas and aerosol concentrations, and air quality, relative to high and very high GHG emissions scenarios (SSP3-7.0 or SSP5-8.5). Under these contrasting scenarios, discernible differences in trends of global surface temperature would begin to emerge from natural variability within around 20 years, and over longer time periods for many other climatic impact drivers (high confidence)
