Contents
- Correlation
- Correlation Coefficient
- Correlation doesn’t logically imply causation
- Correlation can be evidence of causation
- Correlation and Linear Regression
- Mill’s Method of Concomitant Variation
- Math of the Correlation Coefficient
- P-Value for Correlation
Correlation
Correlation between two variables is how much they vary together, in the same or opposite directions.
Correlation Coefficient
- The correlation coefficient, a number from -1 to +1, measures the degree of correlation.
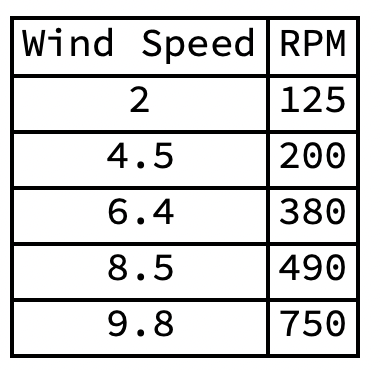
- Consider hypothetical measurements of wind speed and the angular velocity of a wind turbine.
- A scatter plot of RPM against MPH.
- The variables are correlated. But by how much?


- In 1900 the British statistician Karl Pearson developed the correlation coefficient.
- The correlation coefficient runs from -1 to +1.
- A positive value indicates the variables vary in the same direction.
- A negative value indicates the variables vary in opposite directions.
- The greater the absolute value, the greater the correlation.
- Zero means no correlation.
- The correlation coefficient for wind speed and angular velocity of the wind turbine is 0.957972, a strong positive correlation.
Correlation doesn’t logically imply causation
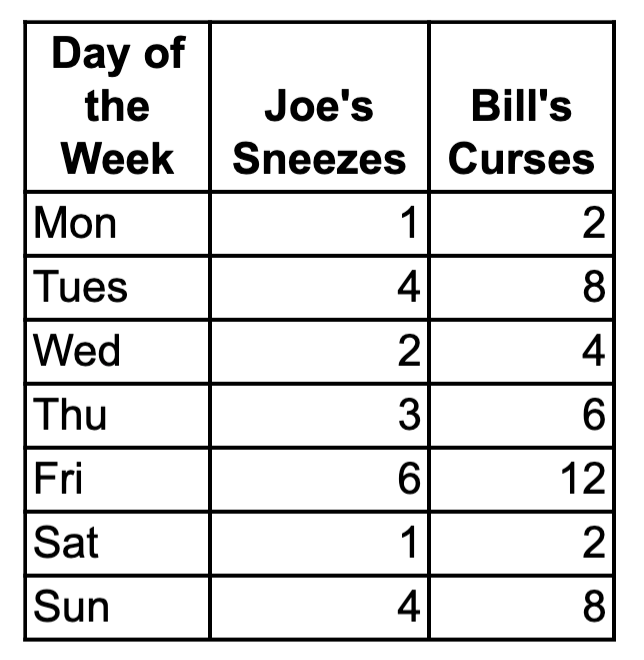
- In New York City Joe sneezed each day of the first week in August. In Texas Bill cursed each day of the same week. A table of their daily sneezes and curses:
- The correlation coefficient is 1.0, a perfect positive correlation. But there’s no causal connection. Correlation by itself does not logically imply a causal connection.
- Inferring causation from mere statistical correlation is the fallacy of cum hoc ergo propter hoc (“with this, therefore because of this”).
- To infer causation you need evidence beyond mere correlation.
Correlation can be evidence of causation
- Correlation can be evidence of causal connection in conjunction with other evidence, such as:
- Other correlations
- Observational studies
- Laboratory experiments
- Randomized controlled trials
- General knowledge
- Three kinds of causal connections between variables X and Y
- X causes Y
- Y causes X
- A third (confounding) variable causes both X and Y
- Causal connections may be complex, for example between income and years of education.
- Education, Income, and Wealth, Federal Reserve
- There’s a positive correlation between income and years of education.
- But…
- Is the correlation because years of eduction open up high-paying jobs.
- Or is it because a person with the drive and wherewithal to go to college has the drive and wherewithal to land a high-paying job?
- Or is it a combination of the two?
- Education, Income, and Wealth, Federal Reserve
- Ecological correlations are correlations between variables pertaining to groups rather than individuals, for example, correlations between percentages, rates, and averages.
- Such correlations provide weaker evidence for causal connections among individuals in the groups than correlations among the individuals themselves.
- View Ecological Fallacy
- Possible explanations for a correlation between X and Y
- X causes Y
- Y causes X
- A third (confounding) variable causes both X and Y
- The correlation is a coincidence
- There’s no causal connection between X and Y
Correlation and Linear Regression
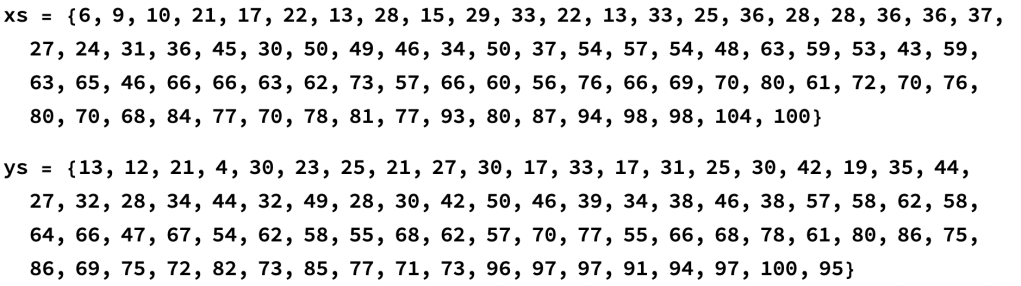
Data points for variables {x, y}
{6,13},{9,12},{10,21},{21,4},{17,30},{22,23},{13,25},{28,21},{15,27},{29,30},{33,17},{22,33},{13,17},{33,31},{25,25},{36,30},{28,42},{28,19},{36,35},{36,44},{37,27},{27,32},{24,28},{31,34},{36,44},{45,32},{30,49},{50,28},{49,30},{46,42},{34,50},{50,46},{37,39},{54,34},{57,38},{54,46},{48,38},{63,57},{59,58},{53,62},{43,58},{59,64},{63,66},{65,47},{46,67},{66,54},{66,62},{63,58},{62,55},{73,68},{57,62},{66,57},{60,70},{56,77},{76,55},{66,66},{69,68},{70,78},{80,61},{61,80},{72,86},{70,75},{76,86},{80,69},{70,75},{68,72},{84,82},{77,73},{70,85},{78,77},{81,71},{77,73},{93,96},{80,97},{87,97},{94,91},{98,94},{98,97},{104,100},{100,95}
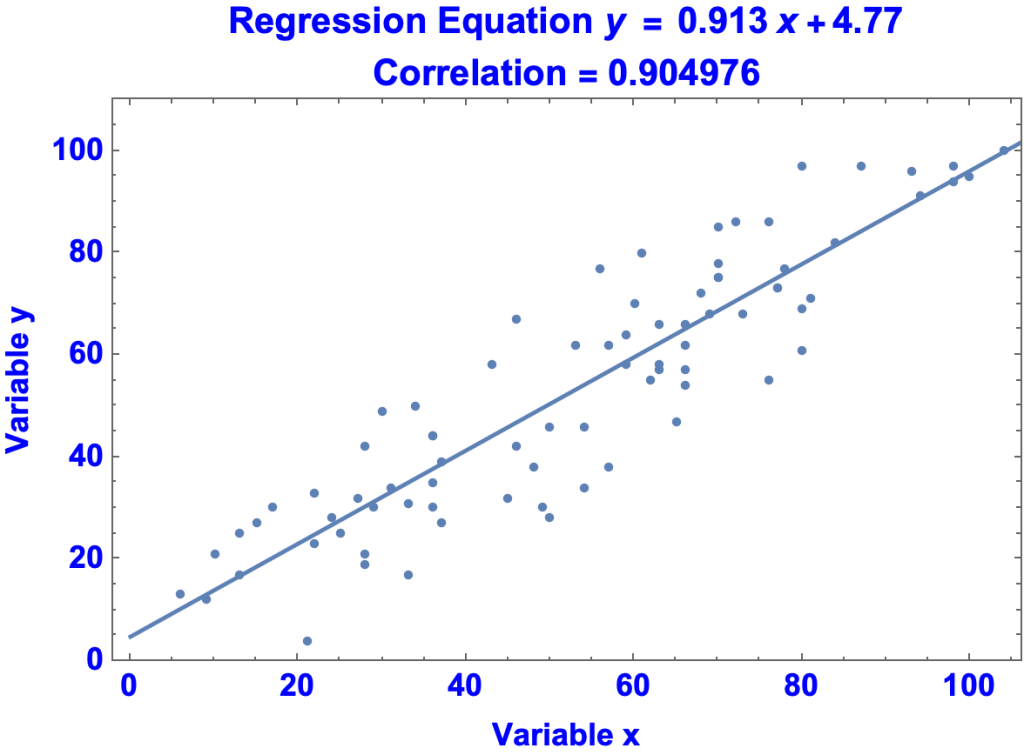
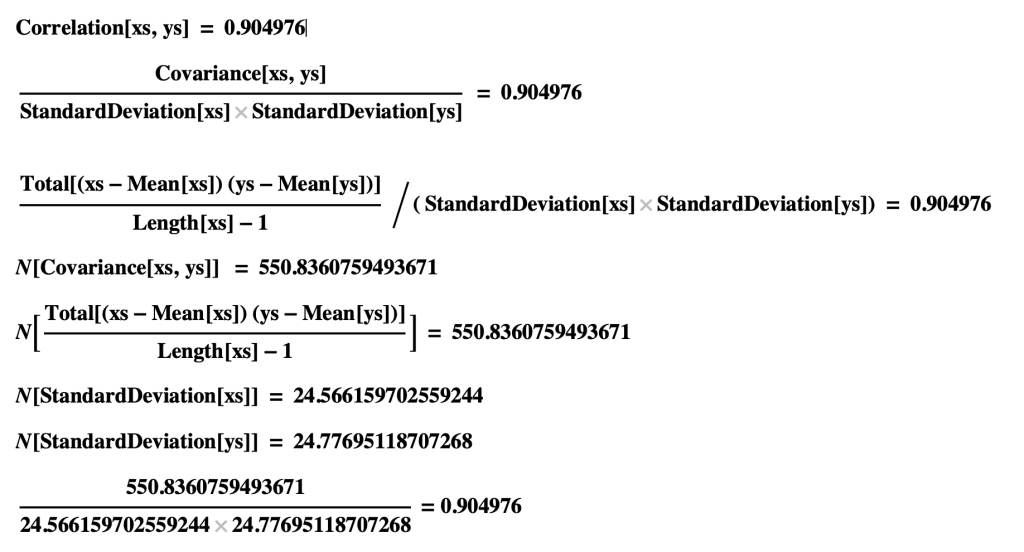
Correlation Coefficient
0.904976
Regression Equation
y = 0.913 x + 4.77
Plot of Data Points and Regression Equation
Predictions from the Regression Equation
- Prediction[0] = 4.8556
- Prediction[50] = 50.4126
- Prediction[100] = 95.9697
View Regression
Mill’s Method of Concomitant Variation
- John Stuart Mill, System of Logic 1874 page 287-288
- “Whatever phenomenon varies in any manner whenever another phenomenon varies in some particular manner, is either a cause or an effect of that phenomenon, or is connected with it through some fact of causation.”
- britannica.com/topic/Mills-methods
- The method of concomitant variation is used when E can be present in various degrees; if we identify a factor F, such as temperature, whose variations are positively or negatively correlated with variations in E, for instance, size, then we can infer that F is causally connected with E.
Math of the Correlation Coefficient
Correlation coefficient for x and y = covariance of x and y / ( (standard deviation of x) (standard deviation of y) )
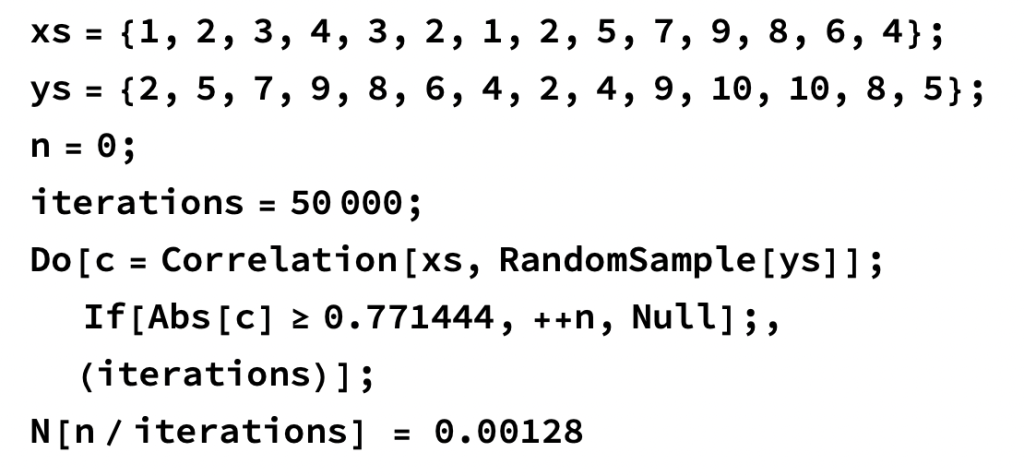
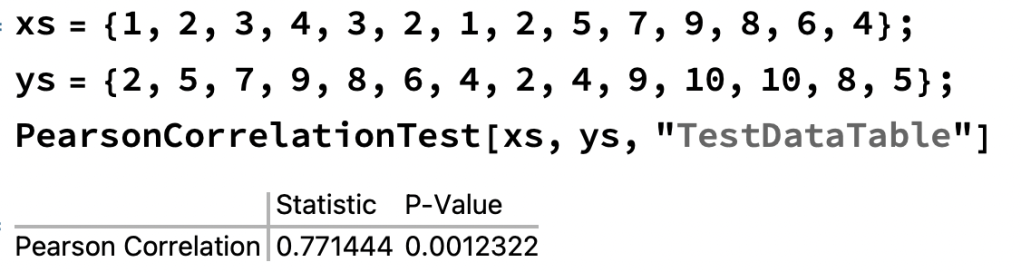
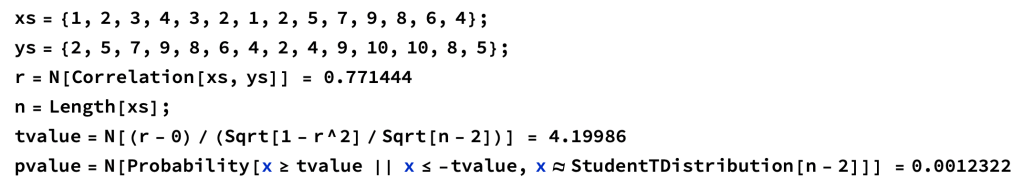
P-Value for Correlation
Pearson Correlation Test
Calculation using T-value
Monte Carlo Simulation using Permutations of ys