Contents
Statistics
- Statistics is the branch of mathematics dealing with presenting, summarizing, and making inferences from data.
- Descriptive Statistics is concerned with presenting and summarizing data.
- Inferential Statistics deals with making inferences from data.
The Process: Data, Statistic, Inference
- The Process
- Data is gathered and recorded
- A statistic is computed from the data.
- A conclusion is inferred from the statistic
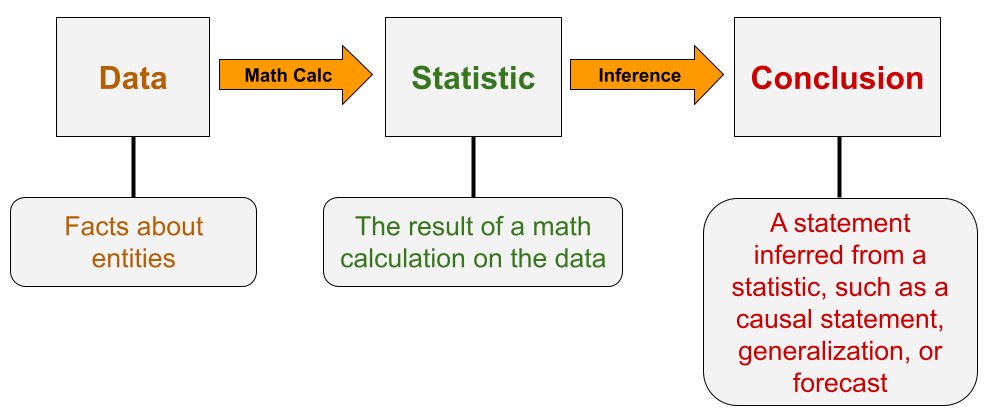
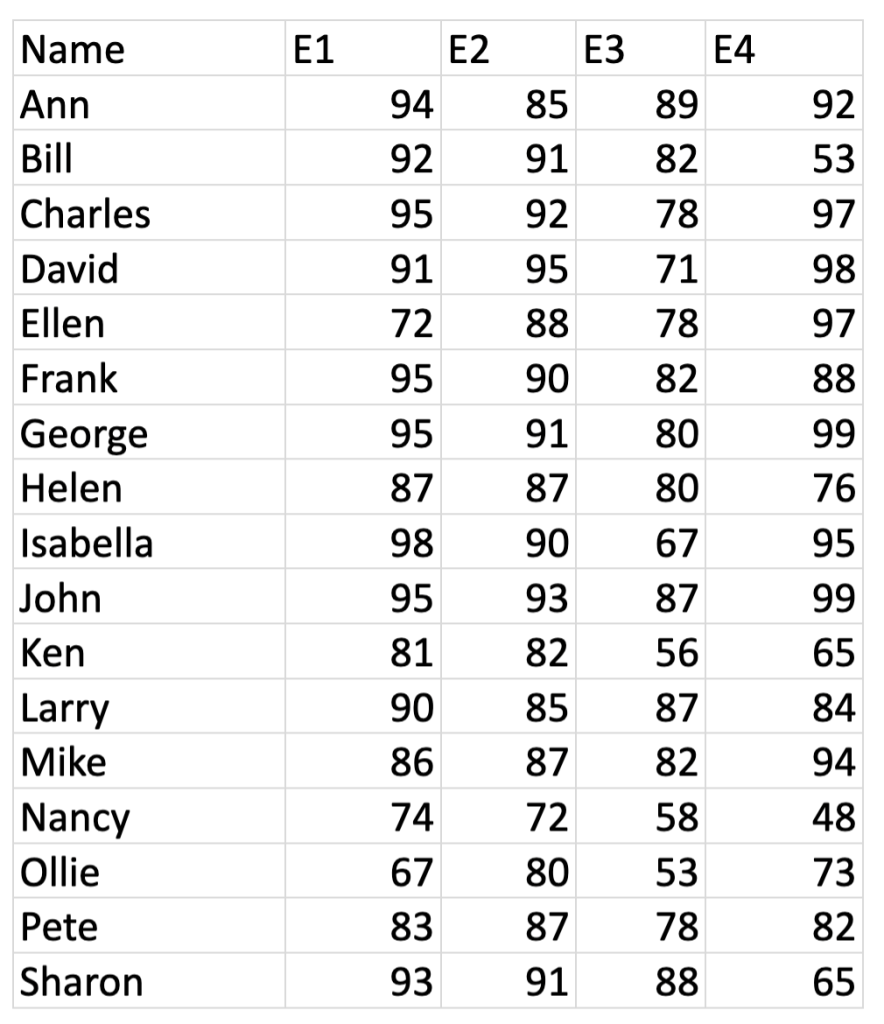
- Data
- Primary (or raw) data are recorded facts about entities.
- Such data can be represented by rows (representing the entities) and columns (representing the facts), e.g names of students and their grades on exams.
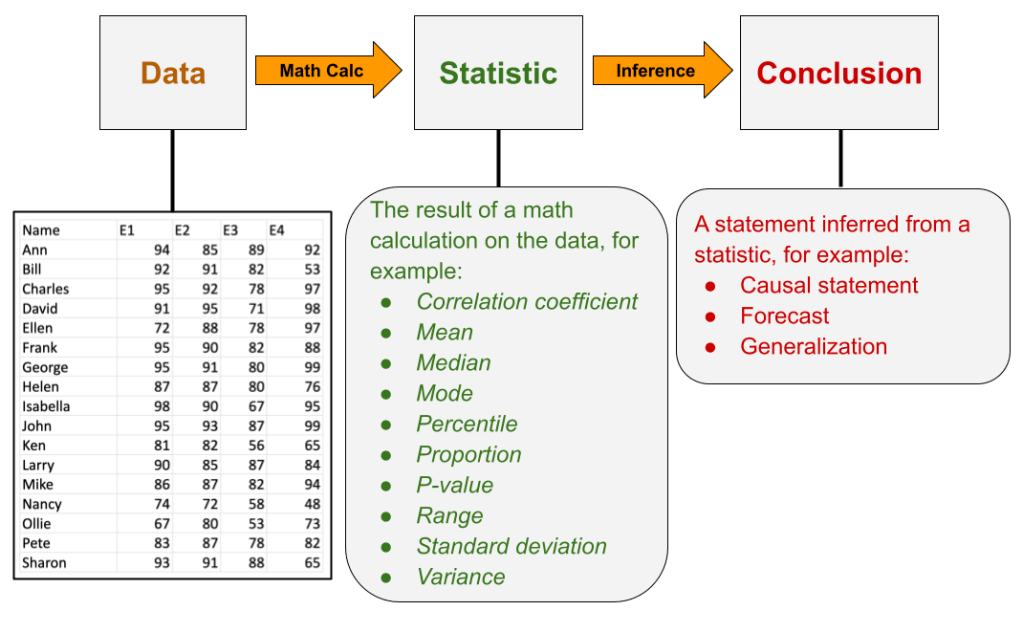
- Statistic
- A statistic is a mathematical calculation on the data, for example:
- maximum, mean, median, minimum, mode, percentage, percent change, proportion, quantile, range, rate, standard deviation, sum, variance
- If the data is accurate and the math correct, the statistic is a hard fact.
- A statistic is a mathematical calculation on the data, for example:
- Inference
- A conclusion is inferred from a statistic
- Kinds of conclusions:
- Generalizations, inferred from random samples
- Forecasts, derived from regressions, time series, and models
- Causal Statements, inferred from correlations, hypothesis tests, and regressions.
Descriptive Statistics
- Descriptive Statistics presents and summarizes primary data, using
- Statistics calculated from the primary data
- Spreadsheets displaying either primary data or calculated statistics
- Graphs representing primary data and calculated statistics visually.
Statistics (i.e. calculations on the data)
- Statistics are used to summarize data.
- Typical statistics
- Maximum, mean, median, minimum, mode, percent, percent change, proportion, quantile, range, rate, standard deviation, sum, variance
- Fancy statistics
- Adjusted
- Inflation-adjusted
- Seasonally-adjusted
- Age-adjusted
- Indices
- Consumer Price Index
- GDP Deflator Index
- Gini Index
- S&P 500 Index
- Adjusted
Spreadsheets
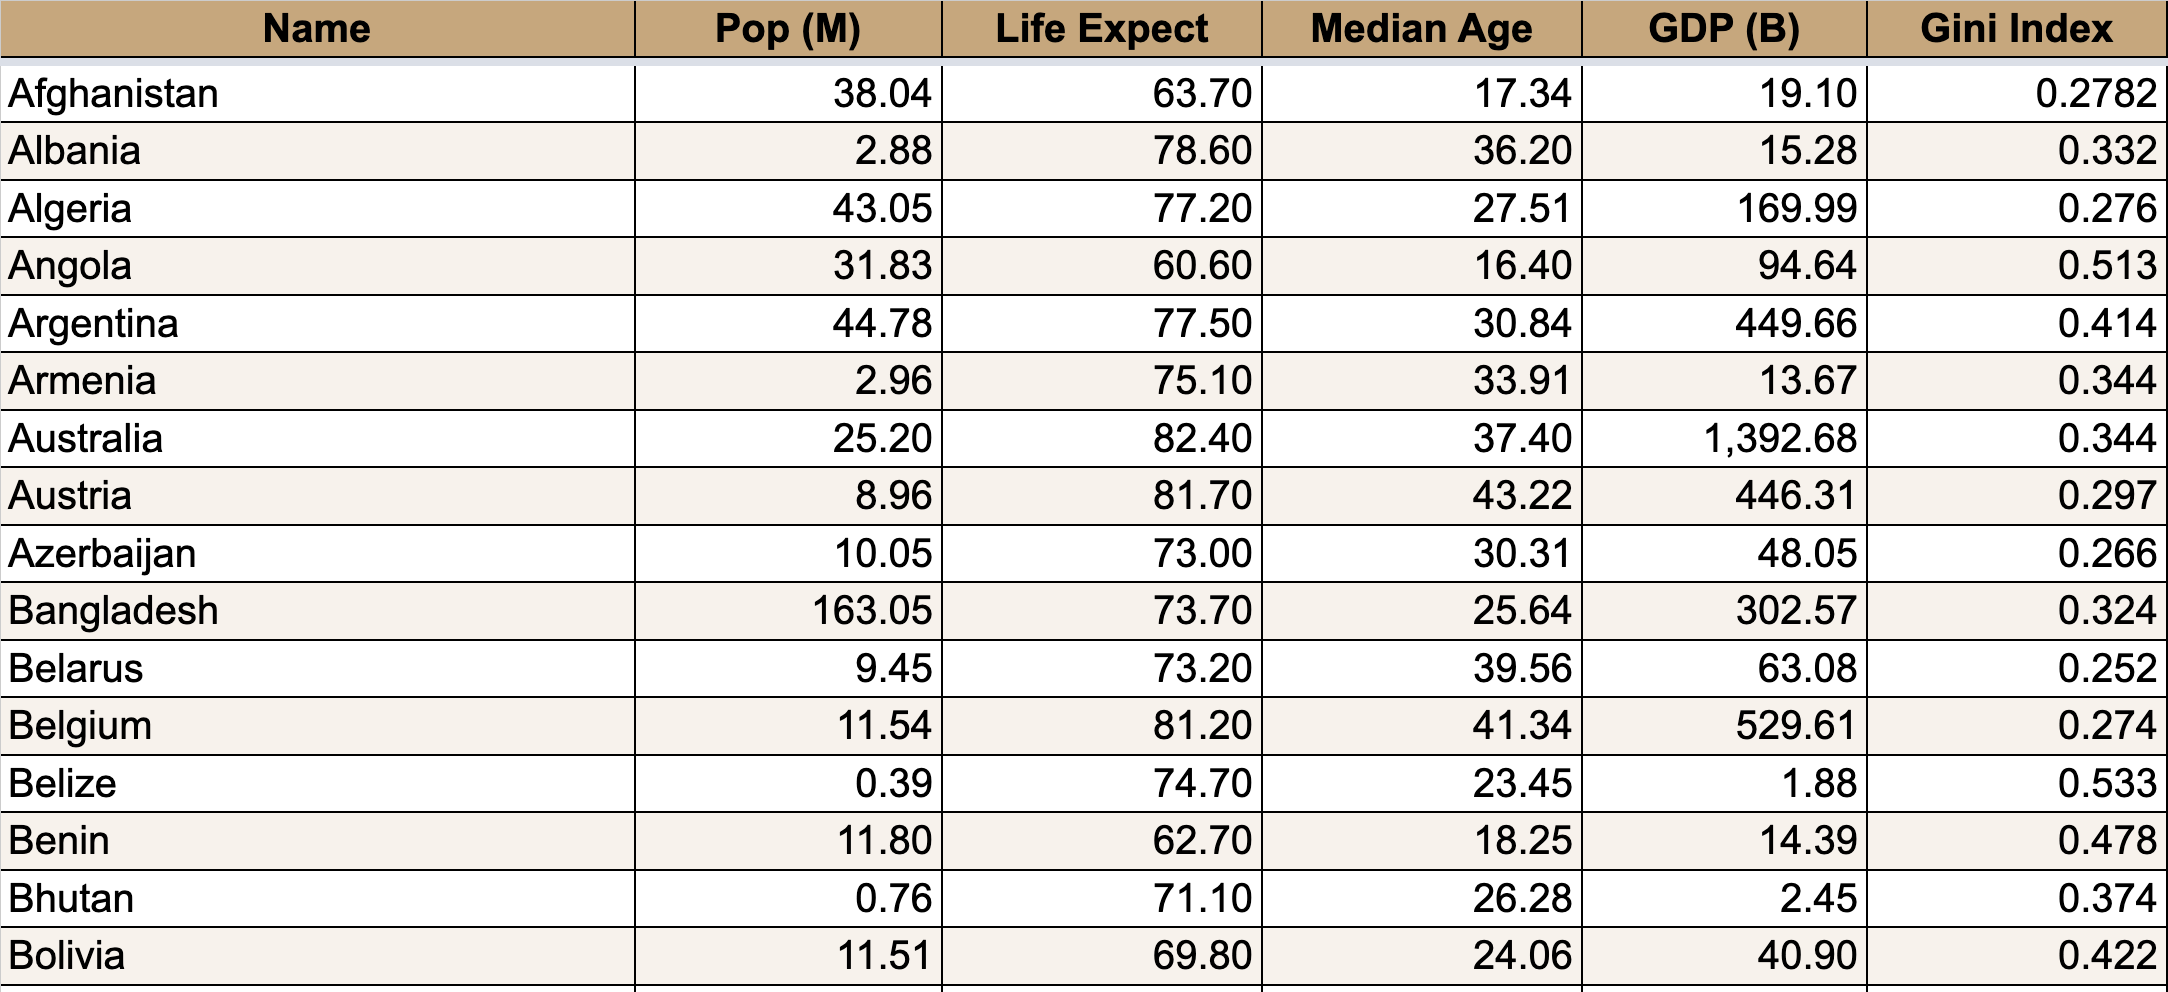
- The rows and columns of a spreadsheet can be either primary data or calculated statistics

Graphs
View Data and statistics used for the graphs
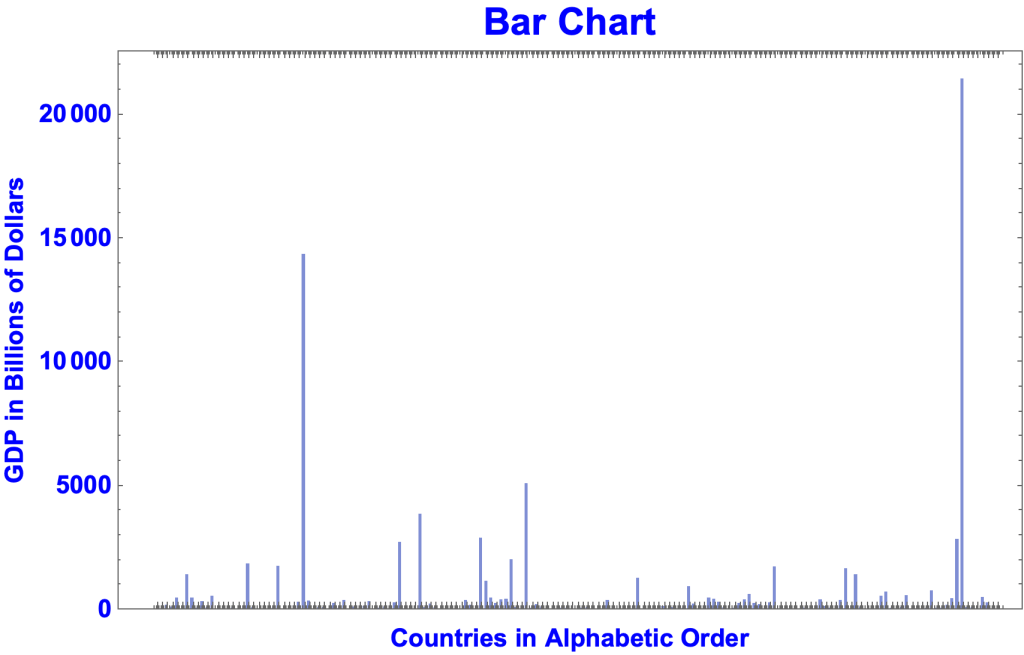
- Graphs represent data and statistics visually.
- In this Bar Chart:
- Bars represent nations.
- A bar’s height represents the nation’s GDP, per the scale of vertical axis.
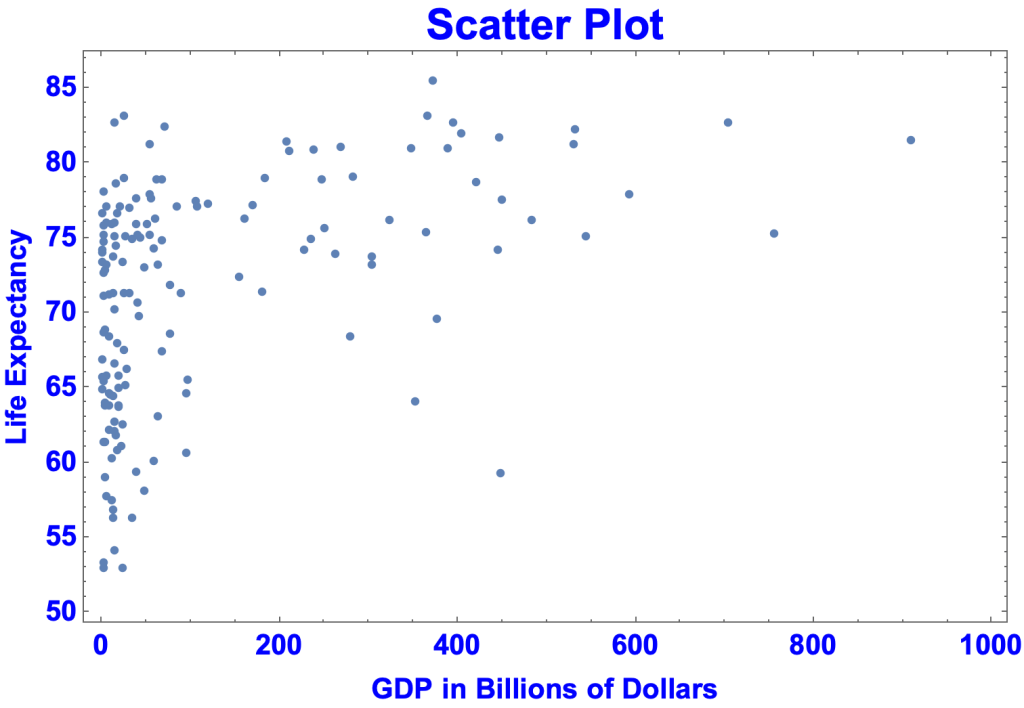
- In this Scatter Plot:
- Dots represent nations.
- A dot’s location indicates the nation’s GDP (per the scale of the horizontal axis) and its life expectancy (per the scale of the vertical axis).
- Histograms represent frequency distributions.
- In this Histogram:
- The bins represent ranges of life expectancies, per the scale of the horizontal axis
- A bin’s height represents the number of nations in its range, per the scale of the vertical axis.
- For example, the rightmost bin represents life expectancies between 85 and 90 years. Only Japan and Singapore qualify.

- The data can also be represented in table form:

Inferential Statistics
- Inferential Statistics deals with making inferences from data.
Kinds of Statistical Inference
- Hypothesis Testing
- Hypothesis Testing uses the concept of probability to assess the extent the data supports a hypothesis. e.g. the effectiveness of a drug given the results of clinical trial.
- The basic form of argument is:
- The data is either explained by hypothesis H or is due to chance.
- It’s unlikely the data is due to chance.
- Therefore, it’s likely H is true, other things being equal.
- View Hypothesis Testing
- Estimation
- Estimation uses the concept of probability to infer the value of a population parameter from a random sample, e.g. a president’s approval rating based on a poll.
- The basic form of argument is:
- A decent-sized random sample from a population exhibits a statistic S, e.g. mean, proportion, standard deviation.
- Parameter P, S’s population counterpart, is derived from S.
- Therefore, in all probability, the population exhibits P within a certain margin of error, other things being equal.
- View Estimation
- Regression Analysis
- Regression Analysis is a set of procedures for finding and evaluating an equation that predicts a dependent variable from a set of independent variables.
- The basic form of argument is:
- Equation E, with a certain degree of accuracy, predicts the observed values of a dependent variable from the observed values of a set of independent variables.
- Therefore, with the same degree of accuracy, E predicts the dependent variable from the independent variables generally.
- View Regression
Two Philosophies of Statistical Inference
- Bayesian and Frequentist Statistics
- Pew Research
- “These models were fit using a Bayesian framework, which means that it is necessary to specify a prior distribution for each parameter in the model. “
- Gallup
- “For results based on the total sample of national adults, the margin of sampling error is ±2 percentage points at the 95% confidence level.”
- View Example
- Pew Research
Probability Distributions
- Fundamental Concept of Inferential Statistics
- Chance measured by a probability distribution (random variable)
Mathematical Theorems Underlying Inferential Statistics
- Law of Large Numbers
- View Law of Large Numbers
- Central Limit Theorem
Two Senses of “Proof”
- Can statistics “prove” things?
- Two senses of “proof”
- merriam-webster.com/dictionary/proof
- 1a: the cogency of evidence that compels acceptance by the mind of a truth or a fact
- 1b: the process or an instance of establishing the validity of a statement especially by derivation from other statements in accordance with principles of reasoning
- merriam-webster.com/dictionary/proof
- Example of 1a:
- Presenting evidence in court that proves the defendant is guilty beyond a reasonable doubt.
- Examples of 1b:
- Mathematical proof, logical derivation, and computation of statistics, e.g. calculation of p-value from the results of a randomized control study.
- Statistics in sense 1b can prove correlations, p-values, and odds ratios, but not causal statements, forecasts, or generalizations. For example, you can’t construct a step-by-step derivation of a causal statement from the results of a clinical trial..
- But statistics can prove statements (that go beyond statistics) in sense 1a, i.e. by presenting evidence (p-values, correlation coefficients, confidence intervals) that prove the statements beyond a reasonable doubt. For example, clinical trials and observational studies have collectively proved (established, shown) that Pfizer’s vaccine prevents Covid cases, hospitalizations, and deaths.
- Two senses of “proof”
