Statistics deals with computing statistics from collected data, presenting the statistics, and making inferences from them
Contents
Descriptive Statistics
Descriptive Statistics is concerned with computing statistics (numerical measures) from collected data and presenting them so they can be readily understood, either in tabular or graphical form.
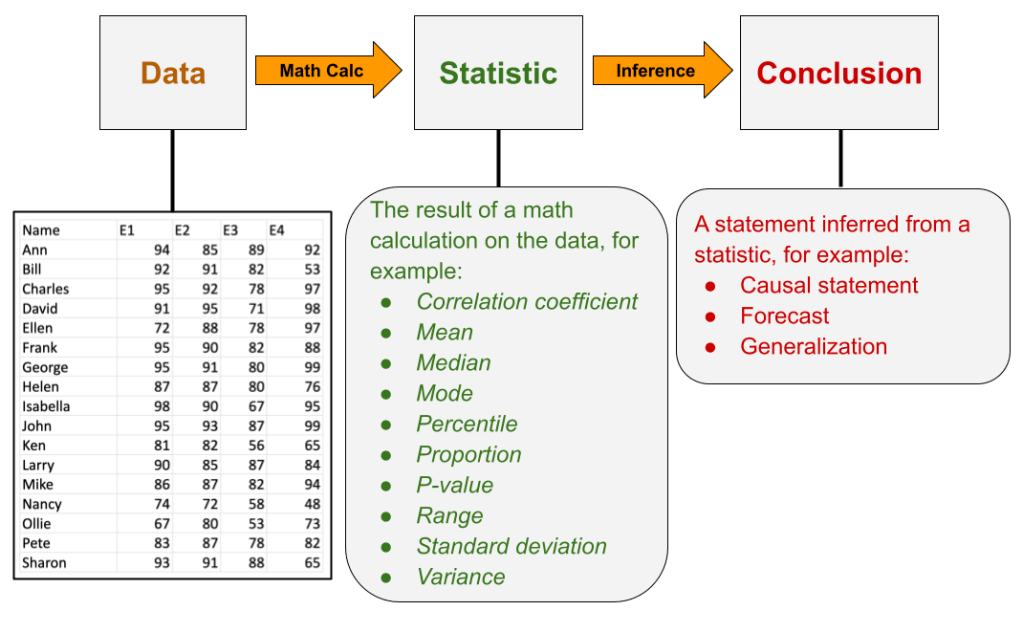
Statistics Computed from the Data
- Some statistics computed from collected data:
- Sum, mean, mode, variance, standard deviation;
- Maximum, minimum, range;
- Median, quartile, percentile;
- Proportion, percent, percent change;
- Indexes such as the Consumer Price Index, Gini Index, and S&P 500 Index.
- Statistics may also be adjusted, e.g. inflation-adjusted, seasonally-adjusted, and age-adjusted.
Statistics in Tabular Form, Examples
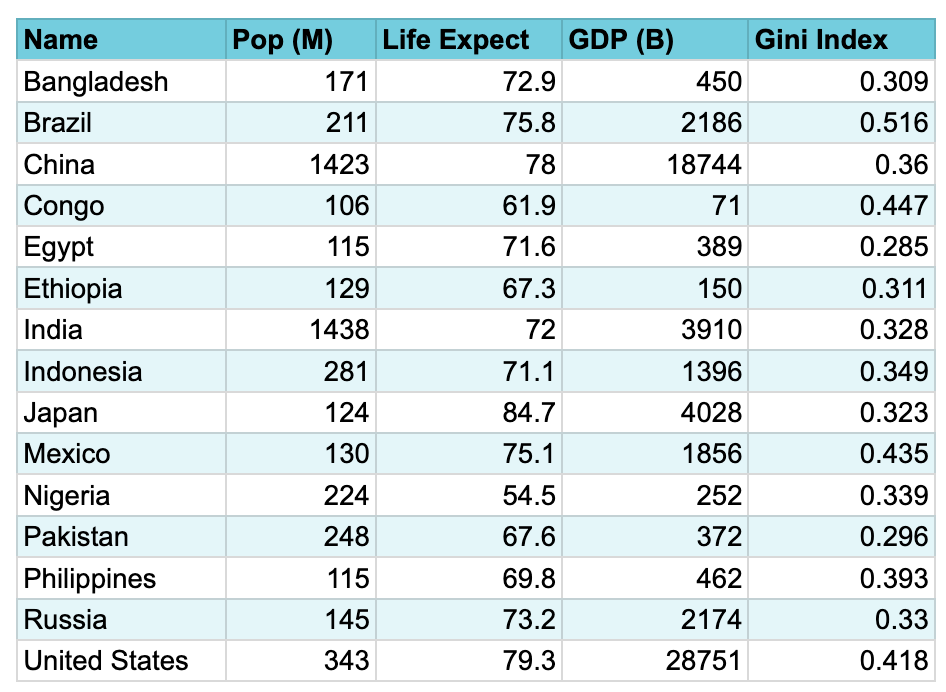
A spreadsheet of four statistics for the 15 most populous countries — the Gini Index is a measure of economic inequality from 0 (where everyone has the same income) to 1 (where one person has all the income).
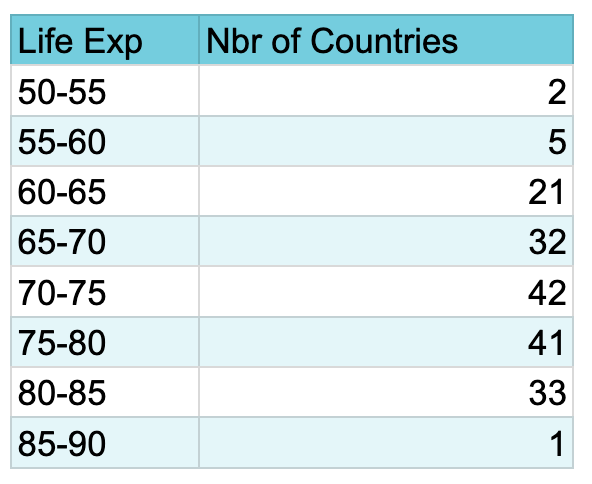
A frequency distribution of life expectancy among all countries
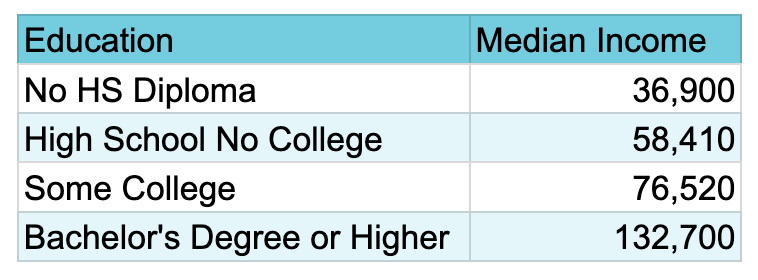
A frequency distribution of median income by educational level
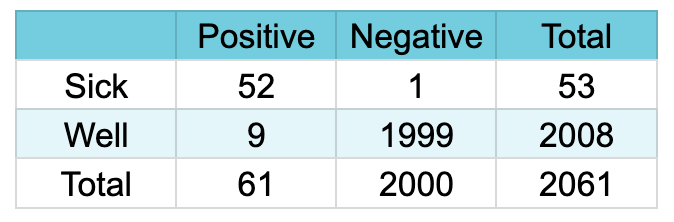
A contingency table (crosstab) of the results of testing a new covid test
Statistics in Graphical Form, Examples
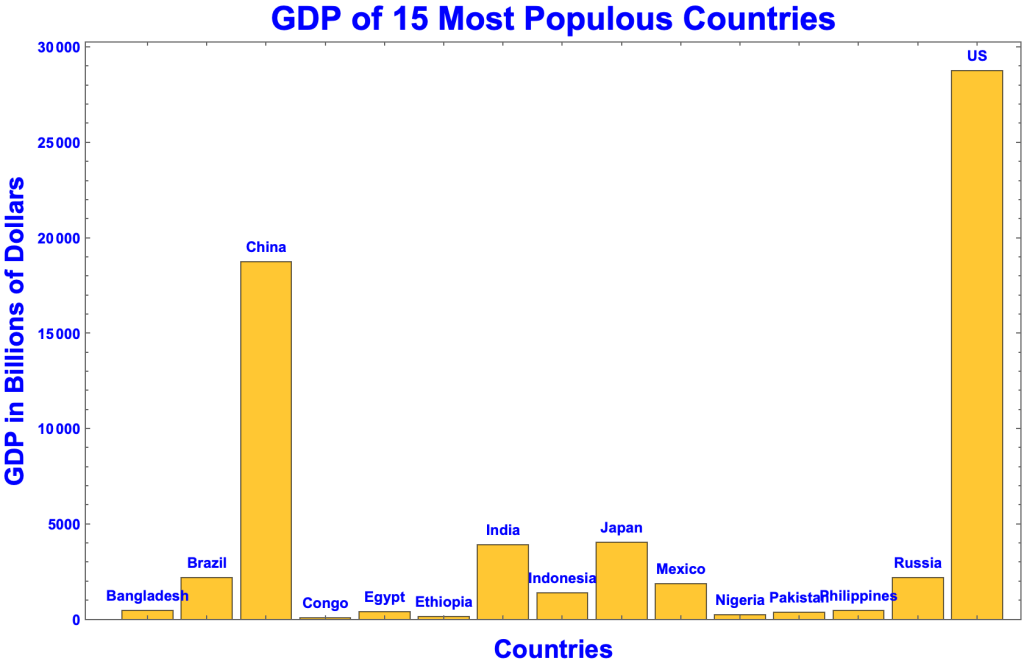
A Bar Chart of GDP among the most populous countries
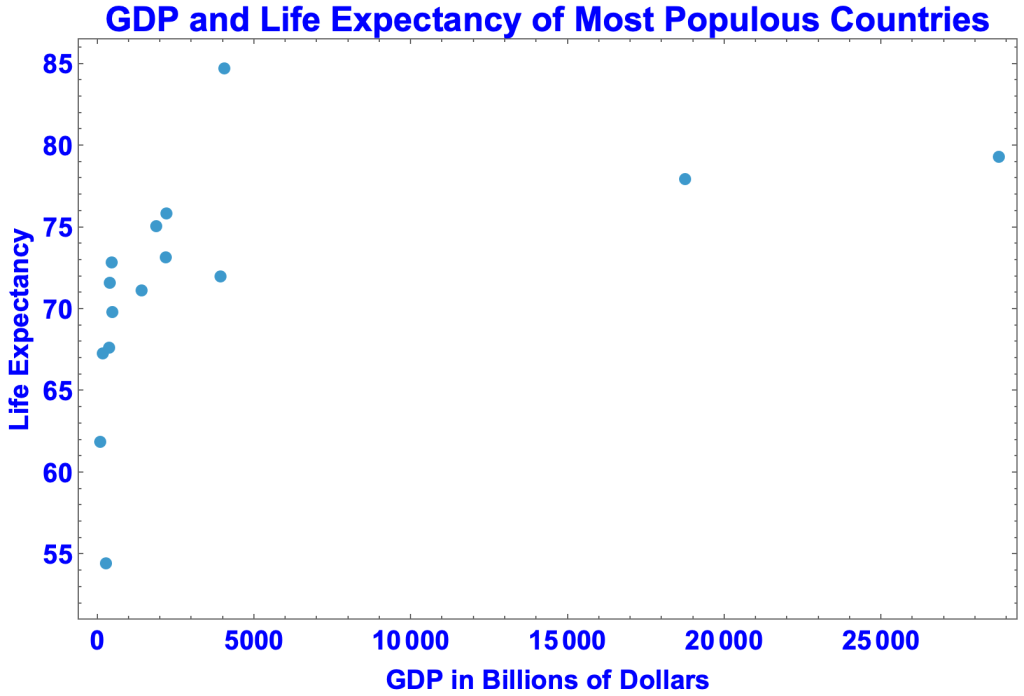
A Scatter Plot of GDP (horizontal axis) and Life Expectancy (vertical axis) — the uppermost dot is Japan, the rightmost the US
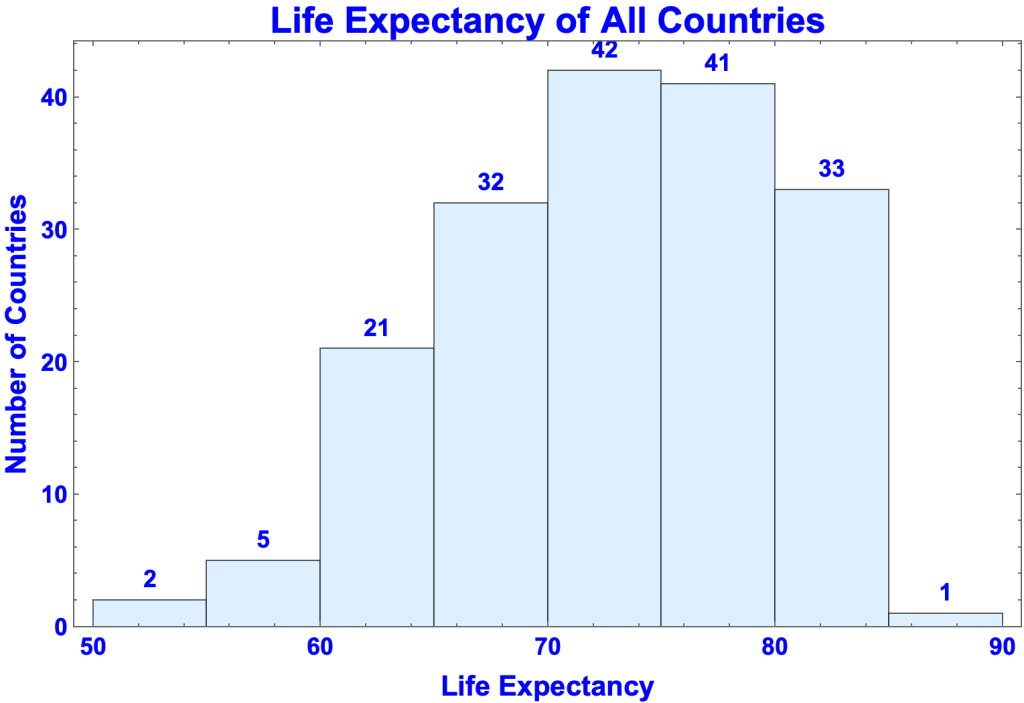
A Histogram representing a frequency distribution of life expectancy
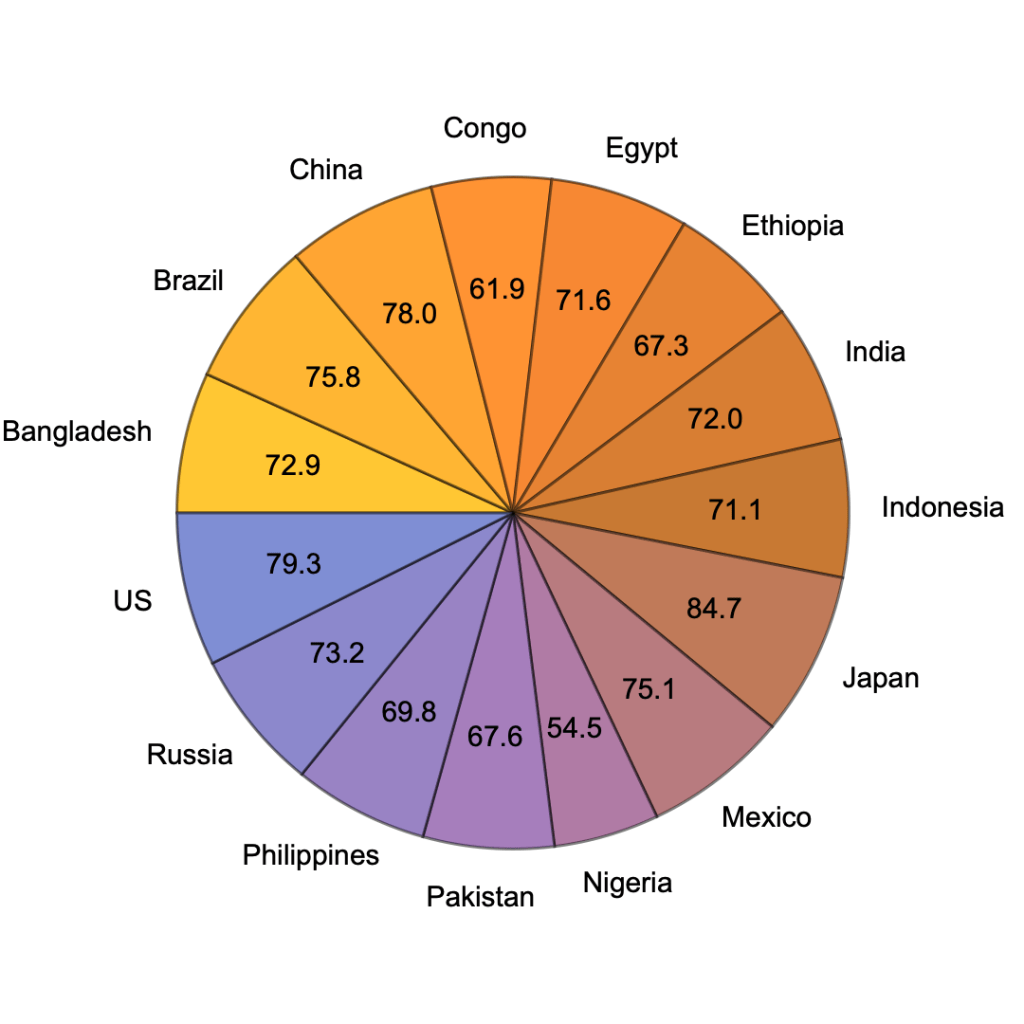
A Pie Chart of life expectancy of the most populous countries, in alphabetic order
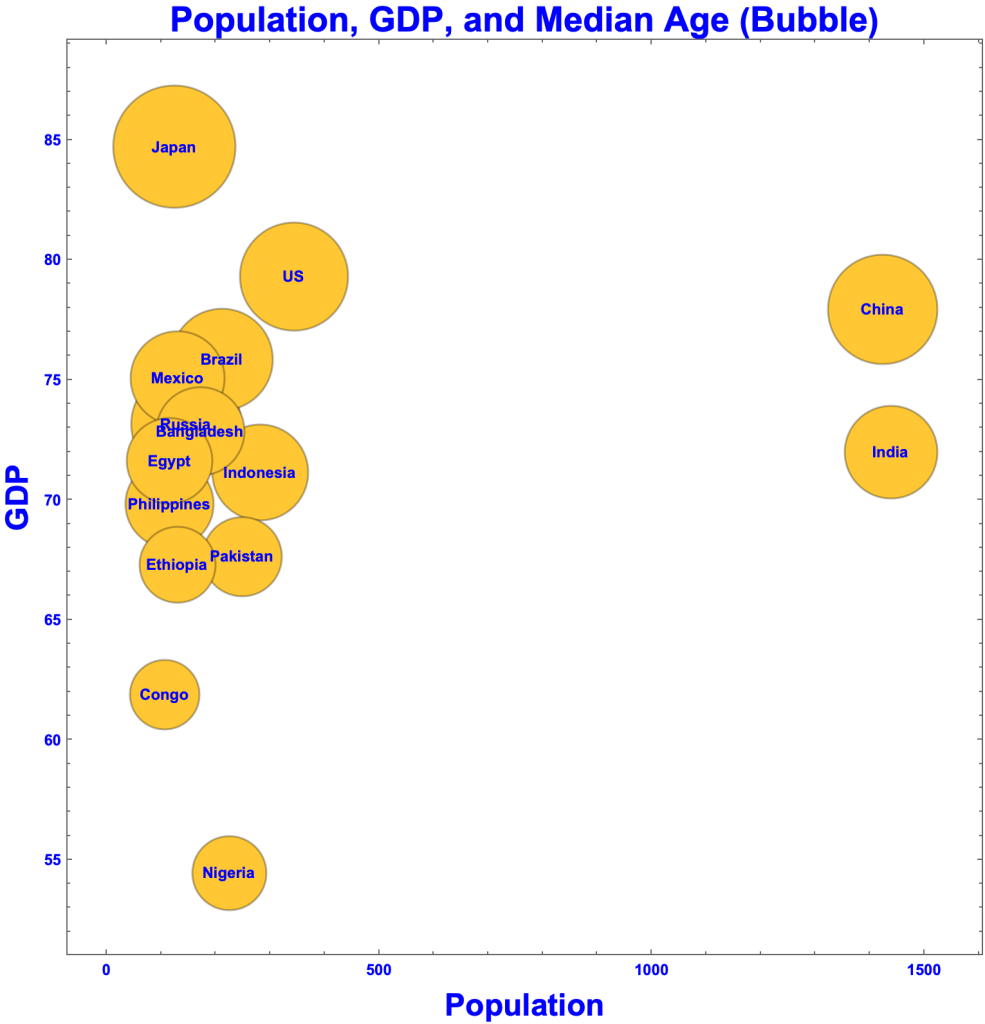
A Bubble Chart showing GDP (vertical axis), population (horizontal axis), and median age (size of bubble — Median age of Japan is 49
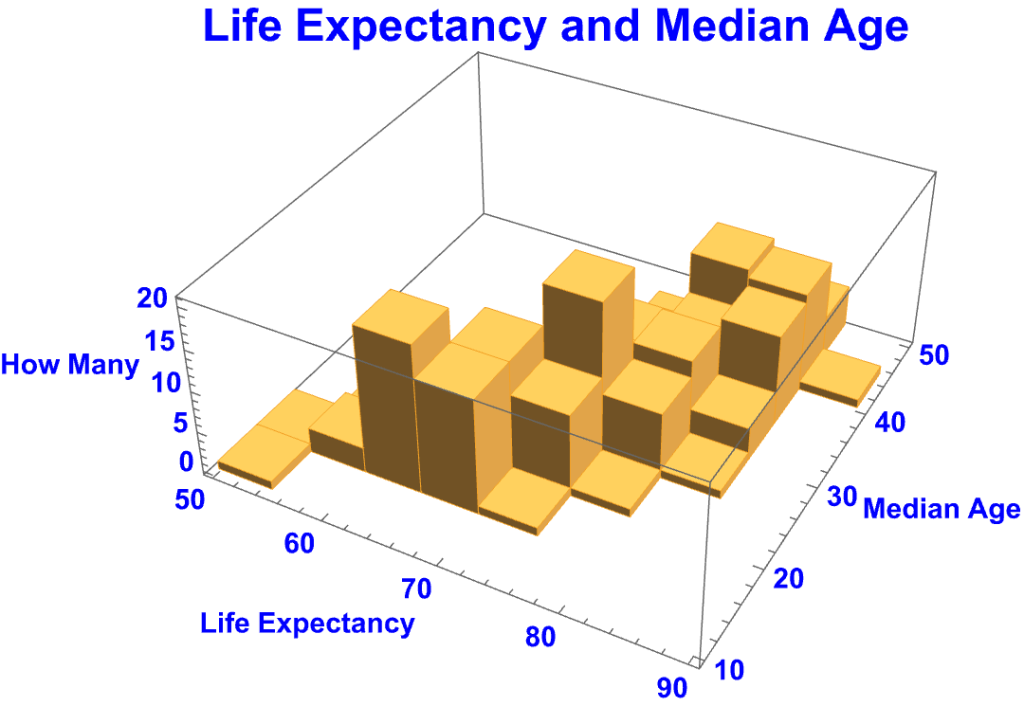
A 3D Histogram showing the number of countries (vertical axis) within squares whose sides are ranges of life expectancy and median age
Inferential Statistics
Inferential Statistics is concerned with making inferences from statistical data.
Kinds of Statistical Inference
- Estimation
- Inferring the value of a population parameter from a sample, e.g. a president’s approval rating based on a poll.
- View Estimation.
- Hypothesis Testing
- Determining how much the data supports a hypothesis. e.g. the effectiveness of a drug based on the results of clinical trial.
- View Hypothesis Testing.
- Regression Analysis
- Inferring an equation that predicts an independent variable from dependent variables, e.g. predicting how fast a galaxy is moving away from Earth based on its distance from Earth.
- View Regression Analysis.
- Forecasting
- Forecasting from the data using tools such as:
- Time Series Analysis
- Regression Analysis
- Decision Theory
- Predictive Models
- View Forecasting.
- Forecasting from the data using tools such as:
- Decision Theory
- Deciding what to do based on the projected consequences
- View Decision Theory.
Tools for Making Inferences
- Probability Theory
- Random Variables and Probability Distributions
- Mathematical Theorems
- Law of Large Numbers
- View Law of Large Numbers
- Central Limit Theorem
- Law of Large Numbers
Two Philosophies of Statistical Inference
- There are two concepts of probability: epistemic and objective.
- Bayesians use epistemic probabilities (in addition to objective probabilities).
- Classical statisticians (frequentists) use only objective probabilities. Their argument:
- Probabilities in science must be testable.
- Only objective probabilities are testable.
- Therefore only objective probabilities may be used in Statistics.
- View Bayesian and Classical Statistics.
Getting Fooled by Statistics
- Statistics is tricky. It’s easy to be fooled.
- View Fooled by Statistics.
